Nifty: Time Cycles, Moving average difference indicator, Neo wave pattern – Aligned Together!
Understanding the short to medium term trend of Nifty with application of Time Cycles, Moving average difference indicator, Neo wave and Bollinger Bands®!
Time Cycles is one of the important tools while analyzing and trading the markets. The combination of Time cycles with Elliott wave and Neo wave can provide high probable trade setups. (How to trade Banking stocks using range bound strategy?) Similar to moving average, time cycles also requires trial and error method and one needs to find out which cycle is working well.
49 days Time cycle is one of the important cycles which have been identified by us many years back and it has been working well even now. Below we have shown part of research taken from “The Financial Waves Short Term Update” which is taken from 29th March research report.
Nifty daily chart: 49 days Time cycles
(Part of research taken from “The Financial Waves Short Term Update”)
Wave analysis:
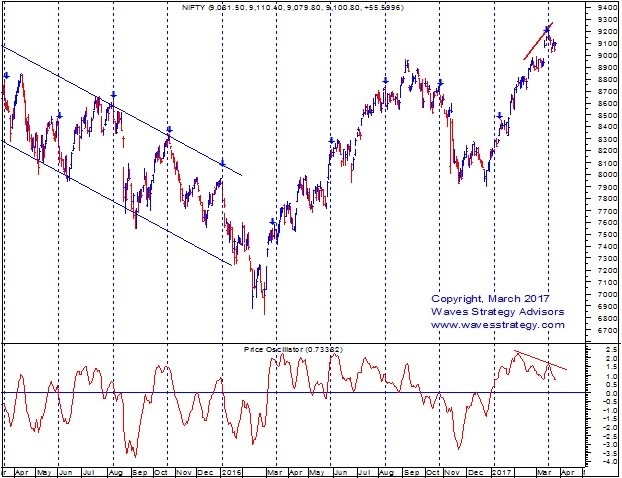
“Time cycle of 49 days: It has been sometime since we visited this Time cycle. We have been following this cycle for many years but it lost its importance for a while during strong trending move of 2014. Nevertheless, post March 2015 this cycle has worked very well for catching important tops irrespective of all the euphoria preceding the fall. Infact, the top made prior to Demonetization was also captured by this cycle. As shown on the second daily chart the important tops as per this cycle is marked on the chart. The high made on 17th March 2017 at 9218 was exactly on this cycle day and it becomes extremely important to pay some heed to it now. As per this cycle, the high at 9217 might remain ……
Moving average difference Indicator: At times non bounded indicators provide subtle changes or divergences which the bounded indicators like RSI might not able to amplify. We can clearly see that Price Oscillator indicator that measures differences between two Moving averages has formed a lower high when Nifty touched 9218 levels. This is another reason why we think the momentum on upside is reducing. At the same time the channel slope has changed from blue to black thereby further suggesting reduction in the speed …..
Neutral Triangle pattern: The overall structure looks like a Neutral Triangle pattern post wave x and currently wave e of the same is ongoing. This wave e is the final leg of up move which should produce series of divergences and result into distribution….
Price confirmation awaited: As Nifty managed to bounce back from short term channel support and protected the lows of ….the near term trend will remain positive unless and until we see close below this level. Price confirmation takes precedence over Cycles and Indicators and we will get negative confirmation only on break of …”
The above research also includes Nifty daily and 60 minutes chart with application of Elliott wave and important levels which is not shown here. The combination of advanced technical tools can provide high probable trade setups.
To know the important levels of Nifty, subscribe to “The Financial Waves Short Term Update” which covers Nifty and 3 stocks on daily basis. We are not buying the euphoria unless our indicators and Elliott wave studies confirm it. See yourself why we are nearing very important juncture which is once in months again! Subscribe now and get immediate access to one of the most objective tools to look at markets without any prejudice!
