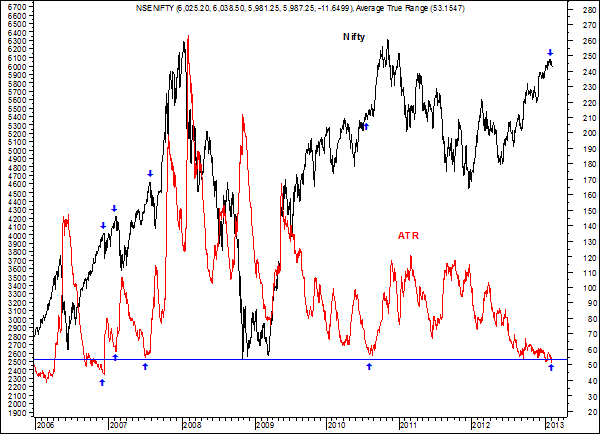
What is Average True range (ATR) indicating for Nifty?
The below excerpt is taken from “The Financial Waves Short term update” of 5th February, 2013 which covered Nifty v/s ATR analysis.
Average True range (ATR) is an indicator that measures price volatility. It is not a directional indicator like RSI or MACD but shows how much prices are moving on average daily basis. ATR has now reached crucial level which was seen before only in 2007 & 2010. Such level has presaged strong tending moves before and shall do so now. Below is the Nifty Vs. ATR analysis.
Nifty Vs. ATR

The above chart is of Nifty and Average True Range (ATR) of 14 days. ATR measures the range of market over past 14 days which is now near 50. This does indicates that on an average on intraday basis Nifty is moving by mere 50 points. We can see that such low value of 50 was seen in 2007, 2008 and only once in 2010. Except 2010 when the move up on ATR was associated with move up on Nifty, rest all the times ATR bounced back from near 50 values resulted in steep down move in index prices. Looking at other technical tools, Elliott wave counts, patterns we think this time as well the up move inATR should be associated with ………
To know the crucial levels on Nifty and the direction from short to medium term subscribe to daily research report “TheFinancial Waves” that provide views on Nifty and 3 stocks derived objectively using technical tools like Elliott waves, Channels, RSI and other indicators and not based on news that come after the move has occurred.

