Bank Nifty Volume Profile – Insight into Institutional Traders
Volume Profile can provide vital information on how Institutional and Big Traders are creating positions.
Below is futures chart of Bank Nifty Futures that gives outlook on major volume activity. The volumes seen in the zone of 35900 – 36200 has been the highest. This Volume at Price indicates if Bank Nifty fails to move quickly above 36200 than weak hands can be in real trouble.
Bank Nifty Futures chart
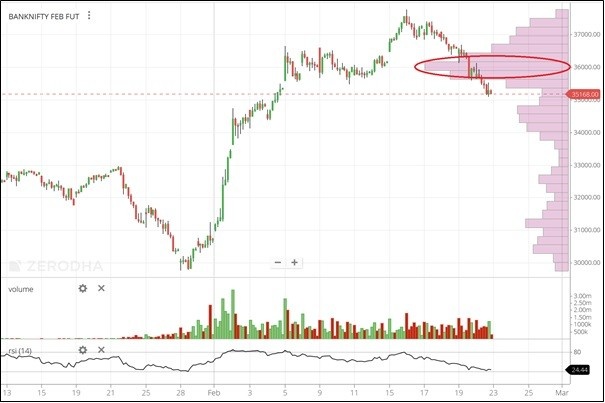
Looking at the above Bank Nifty chart one can see the biggest volume profile is in the zone of 36200 – 35900 levels. As soon as this profile was broken on downside by prices there was a minor retest on upside post which the selling pressure intensified. Despite of all the euphoria and super bullish sentiments prevailing some major activity has taken place in the highlighted zone.
Volume Profile alone is not the only way for taking signals but gives the important context to the market. Next support as per this method is now near 34600 levels. A breach below this level can result into severe declines as there are very less change of hands till 31200 levels.
In short, for positivity to emerge back in Bank Nifty we have to see move back above 36200 levels with important support lying near 34600 on downside. Break below 34600 on Bank Nifty Fut will result into bigger declines.
This is simple way of understanding what the big players are doing in the market and this when combined with Candlestick techniques and Time cycles can simply give the “Aha moment” that one has been searching all the while.
Trade with me – 3 months of Mentorship starts in March 2021 – “Life transformation” is what most of our existing mentees have been calling the program. Capture the big trends using simple ways of understanding institution activities which had been available only to a limited few so far. Take this leap for the lifetime investment.
