Nifty: Power of Time cycles & TRIN indicator!
Hurst’s Time cycles has worked amazingly well yet again. We have also applied TRIN indicator in the morning research report on Nifty charts.
See below how to apply various technical indicators on charts along with advanced concepts of pattern recognition using Advanced Elliott wave, Neo wave, Time cycles and TRIN indicator.
Many say it is better to keep it simple but that will work when markets are not complex. Also we have proven track record to catch major tops and bottoms which we did by anticipating a top near 11000 mark and a low near 10200 levels! Yes, below is the proof!
Below chart of Nifty was published on 12th March morning before equity markets opened
Nifty 60 mins chart: Anticipated on 12th March 2018
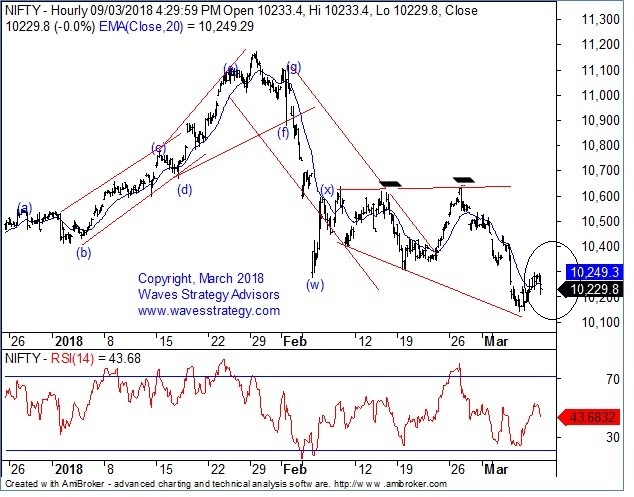
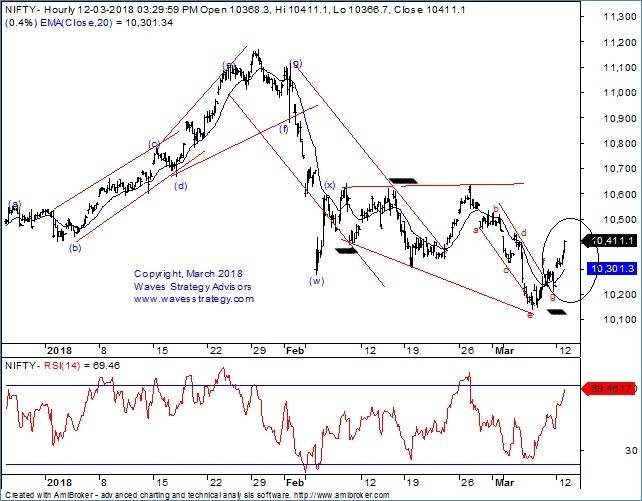
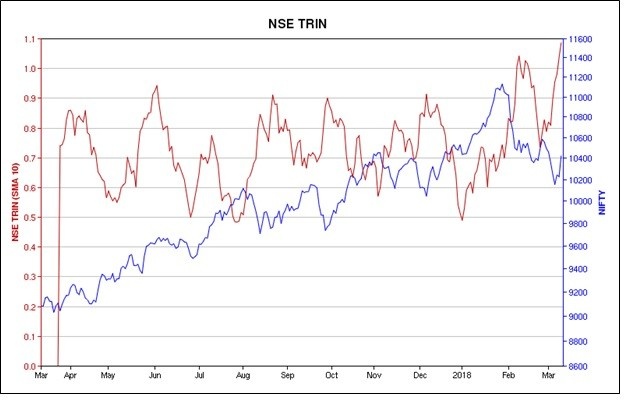
Chart courtesy: icharts
Anticipated on 12th March morning research report – The Financial Waves short term update
“On 8th March, Nifty had acted exactly the same as we mentioned regarding the positive reversal in our February report as per Hurst’s time cycle. So, there is high possibility that the low made at 10140 will remain protected atleast over next few days or weeks which will be against majority expectations. We turned bearish near 11000 mark when everyone was bullish and now it is time to again take a contrarian stand. A break above 10350 levels followed by 10400 levels could indicate a potential uptrend is starting.
As shown on hourly chart, our contention that an Expanding triangle is forming has been validated as of now since prices took strong support near the a-c trendline. Now faster retracement back above 10400 will indicate that wave e of this triangle is probably over and the short term low is formed.” BANG ON!
Nifty moved precisely as expected. Prices formed a low and reversed exactly as expected. So what is next from here? In today’s morning research we published another important indicator – TRIN…
The Arms Index (TRIN)
TRIN was invented by Richard W. It is an indicator used by technical analyst to predict price movements based on advances and declines with respect to their volume. It is calculated by dividing advance to decline ratio by advance to decline volume ratio.
We are showing TRIN indicator that measures the overbought and oversold conditions by involving price and volume. When the TRIN line is near the highs it is assumed to be in oversold state as lot of volumes has gone on the short side. So it works opposite to indicators like RSI where the oversold state on downside. Also if you observe carefully most of the times this indicator has inverse correlation with that of prices. We can now see some extreme reading here which was not visible for entire year thereby indicating a strong oversold state. This has happened because there had been more declining stocks even yesterday than advancing. We can expect this to reverse thereby supporting index to move further higher from here on.
As shown on hourly chart, our apprehension that the fall below 10276 is a bear trap had been vindicated and we can clearly see how important it is to stay objective despite of all the pessimism that was across when Nifty broke below this level. We were bearish near 11000 when everyone was super bullish and now we turned bullish when majority expected break below 10000. The major reason was Time cycles and the internal Neo wave pattern. Prices indeed formed an ……….
In short, …………..
Subscribe now to “The Financial Waves short term update” and capture the next big trend despite of all the news and events. This research covers Nifty, Bank Nifty and stocks on daily basis. Subscribe annually and get flat 30% off. Get access now
