Power of Hurst’s Time cycles combining with Channels and indicators!
Time cycles is a very important concept if applied properly will help us understand where the important lows will be formed. When you combine this with Channels and Indicators like ROC it provides very powerful forecasting ability.
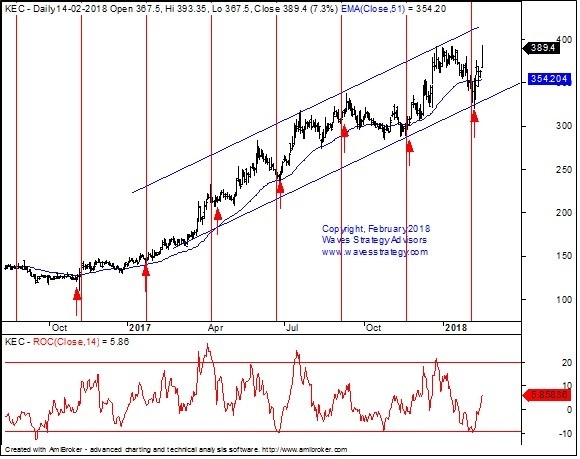
Look at the below chart of KEC international which was published today morning in the daily research report – The Financial Waves short term update.
KEC INTERNATIONAL daily chart:
Wave analysis: Following was published today morning
KEC International had been a strong outperformer from the Capital Goods space. We can see that majority of the stocks from this sector had underperformed but this stock has continued to rally all the while and is now on the verge of giving a strong break above the previous important high made at 392 levels.
Time cycle of 51 days –We can see this Time cycle working extremely well. Prices are forming lows every 51 days and the recent low made near 319 was also on the time cycle day along with the channel support. It is amazing to see how different techniques point towards the same outcome i.e. a low formed near 319 and we are now seeing a very strong positive move.
Price ROC –This indicator has important support near -10 and we can see a very clear reversal from the lows of the same level from where ROC reversed even previously. So it is best to stay on the long side unless we see the level of 20 on this indicator. There is still plenty of room to be covered on the upside.
In short, KEC showed a very strong positive close in previous session. Now move ……..will continue the up move towards ……… levels with ………… as short term support.
Charting Tool: Plot your chart on KEC
The above research clearly shows how we can combine Time cycles along with Channels and indicators. Also KEC showed a strong bounce towards the level of 408 in today’s session itself.
Free monthly research with daily equity report. Subscribe to “The Financial Waves short term update” that covers Nifty, Bank Nifty, stocks and see yourself power of Elliott wave, Time cycles with application on charts. Also as a special offer – Subscribe annually and get monthly research free along with it. Simply select annual subscription for equity research report. We will set you for the free monthly research – Pricing page
How to trade using Hurst’s Time cycles along with indicators and channels? Register now for the 2 days of training workshop on combining Elliott wave, Neo wave with Time cycles scheduled on 10th and 11th March 2018. Also learn how to derive ideal trade setups. These methods helped me to catch the top at 11120 levels as mentioned previously and I will be more than happy to share across each and every method I use to derive trades… Know more
