Reliance Industries: Application of Time Cycles with Elliott wave!
Reliance Industries – How to apply Time Cycles, Elliot wave and basic technical analysis indicators.
Majority of the oil and gas sector stocks such as HPCL, BPCL, IOC, etc is showing sideways to negative action. However as against to this Reliance has been outperforming and has shown steep rise in last few days. Recently prices have reversed from the important support zone which indicates that next leg on upside has started as per Elliott wave pattern.
The below daily chart of Reliance shows the magic of Time cycle along with Elliott wave and how a trader can use these methods to capture a trend. Below part of research is taken from “The Financial Waves Short Term Update” dated 21st June 2017.
Reliance daily chart:
(Part of research is taken from report dated 21st June 2017)
Wave analysis
Reliance Industries had been one the outperformers in 2017. This stock again showed sharp rise after completing an important low. Let us see what charts are suggesting!
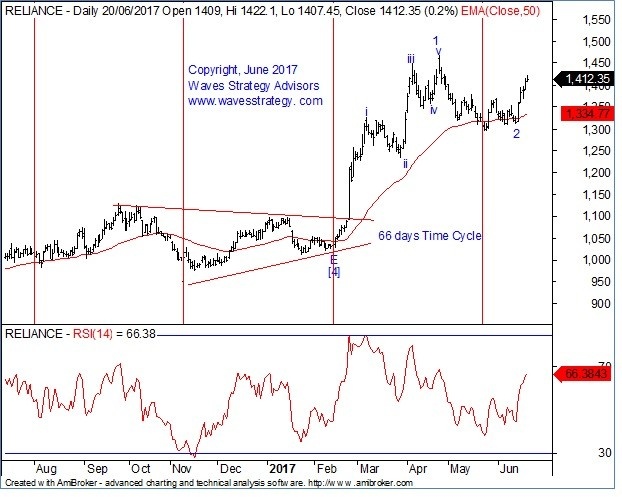
Elliott wave and Time cycles: As shown in daily chart, post the completion of wave 2 near 1310 levels prices exhibited a sharp move on upside and has retraced majority of down move in just 4 to 5 days. Such a sharp rise indicates that an important low as been formed near 1310 levels in from of minor wave 2 and next leg as started on upside in form of minor wave 3. The 66 days bottoming time cycles has been working extremely well on the above daily chart which was due in mid of May 2017. This 66 days time cycle further confirms that a major low has been formed and now the medium term trend has reversed on upside.
As per bar technique, prices are protecting the prior day bar low from past 5 days which indicates that the bulls have a strong hold over this stock.
(We have not shown the 60 mins chart in this article as it has been cover in our Equity Report.)
As shown in 60 mins chart, the recent range bound action has relieved the RSI form it overbought zone and has made some more space for the prices to move on upside. Also the 20 periods EMA is still acting as a support which further indicates positivity in the trend. During such price action it is advisable that traders should avoid catching top and can make use of buy on dips strategy in order to gain from this trend.
In short, bias for Reliance is positive where …. is an important support. Move towards …. If this is indeed a 3rd wave we are going to see some very strong rise in this stock. So stay positioned accordingly but use strict stop levels in case the broader market reverses.
To know the Elliott wave pattern and important support and resistance levels of Reliance from trading perspective, Get access to “The Financial Waves Short Term Update” which covers Nifty and 3 stocks on daily basis.
Attend the Most advanced training EVER on Technical analysis – Elliott – Neo wave combined with Hurst’s / Gann Time cycles to understand and pin point the reversal areas with strong confirmation using two stage confirmation techniques that virtually guarantees that the ongoing trend is over. For details about this two days seminar visit – Most Advanced training on Technicals
