What is Neo Wave Neutral Triangle pattern? Applied on MCX Crude!
Neo wave is advanced concept of Elliott wave. Neo wave has many rules to define an impulse Elliott wave pattern.
If any of these rules is not met then it clearly suggests that corrective
trend is ongoing. Below we have shown one of the patterns which is known as Neo
wave Neutral Triangle pattern. This pattern looks very similar to the Inverted
Head and Shoulder pattern as per basic technical analysis. In this pattern
wave c is the longest, most subdivided and time consuming which provides the
early indication for its development.
Look at the below chart which is given in Neo wave theory:
Neo wave
Neutral Triangle Pattern Text book:

Now just look at the below chart of MCX Crude which is almost the mirror
image of the above the chart:
MCX Crude
daily chart: (Neo wave Neutral Triangle
Pattern)
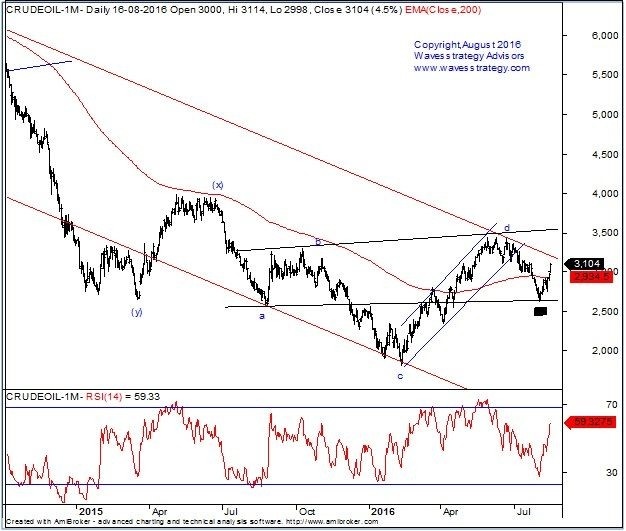
The above chart replicates the ideal pattern. However there is more to
it. For confirmation that the prior trend is over it is important to see faster
retracement above the last falling segment. Failure to see this will indicate
that the pattern is still ongoing and is not complete.
So what it indicates for the next trend? Is MCX Crude bottoming out from
medium term perspective? and if yes then what are the reversal areas to watch?
Subscribe to The Commodity Waves
Short Term Update which covers Gold, Silver, Crude and Copper with
Elliott wave and important levels. For more information visit Pricing Page
