How do Elliott and Neo wave differ? Nifty Diametric pattern importance
Neo wave is an advanced Elliott wave method with more number of rules and newer patterns which helps to increase trade objectivity and provides classical trade setup.
Any price movement as per basic Elliott wave is classified into Impulsive and Corrective. There are various patterns within these broader heads. Impulsive waves need to follow three basic rules:
- Wave 2 cannot retrace complete of wave 1
- Wave 3 cannot be the shortest of the directional waves 1, 3 and 5
- Wave 4 cannot enter into territory of wave 1
The above 3 basic rules if followed then the price movement under consideration can be classified as a normal Impulse wave.
However, when the market structure is complex there is possibility that the movement can be counted in many different ways. This can result into subjectivity and the entire purpose of wave theory can be lost. To overcome this limitation Neo wave was developed that has more than 15 different rules to define a simple impulse pattern. Following are a few of them:
- Wave 2 cannot retrace more than 61.8% of wave 1
- Wave 3 cannot be the shortest of the directional waves 1,3 and 5
- Wave 4 cannot enter into territory of wave 2
- There has to be at least one extended wave which is going to be 1.618% of non extended wave. If there is no extension then the pattern under consideration is corrective
- One of the directional waves should subdivide
- Corrective waves should consume more time than the preceding impulsive wave
- Touch point rule: Out of 6 points not more than 4 points should lie on the channel
- …
- …etc
The above shows only a few set of rules for an impulse pattern as defined by Neo wave. There are newly developed patterns as well which were never a part of original Elliott wave. To name a few are:
– Diametric Pattern
– Neutral Triangle
– Extracting Triangle
We take a step ahead and combine this complex study of Neo wave to that of Time cycles. It is not always that both the studies will be in sync but when they are indeed suggesting the same outcome that is the time that the trade setup is of very high accuracy and it just leaves only one probable outcome. These are the times when one can go all in with prudent risk and money management strategies which have the potential to give the best of the returns in shortest amount of time.
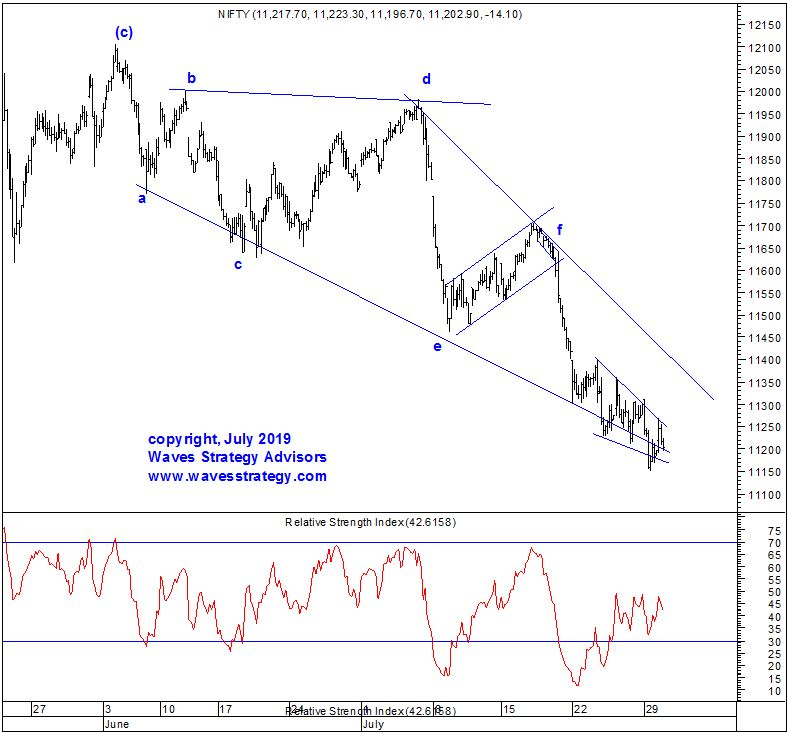
Below is the latest Nifty chart showing Diametric pattern. It is a seven legged correction labelled as a-b-c-d-e-f-g. Prices are currently moving in the form of wave g. So where do you think the current down fall will halt?
Nifty 60 mins chart:
We are showing a Time cycles in our daily equity research. The earlier cycle provided short term pullback for few days before prices reversed. Will the current cycle also provide short term upside trend? You can get detailed research in “The Financial Waves short term update”
References are taken from “The Financial Waves short term update” daily research report which covers Nifty, Bank Nifty and stocks on rotational basis and “The Financial Waves Monthly update” that shows medium to long term perspective on Nifty, INR Pairs, Global Markets, Gold, other commodities. For subscription options visit Pricing Page
Attend the most Advanced Technical analysis training on Application of Neo wave and Time cycles with practical charts on different time frames for intraday to positional trading and investments. This training will focus on the above methods along with lot of other studies which can be combined together to produce very high conviction trade setups. Register NOW – For more details Contact US or write to us at [email protected] or call us at +91 22 28831358 / +91 9920422202
