Ichimoku Cloud and Bollinger Bands® on Nifty
Ichimoku cloud is an amazing method if applied correctly. There are various indicators plotted on the chart when you apply Ichimoku Cloud.
Also Bollinger Bands on hourly time frame provides vital information if we are back at the support zone or if a trending move is about to emerge.
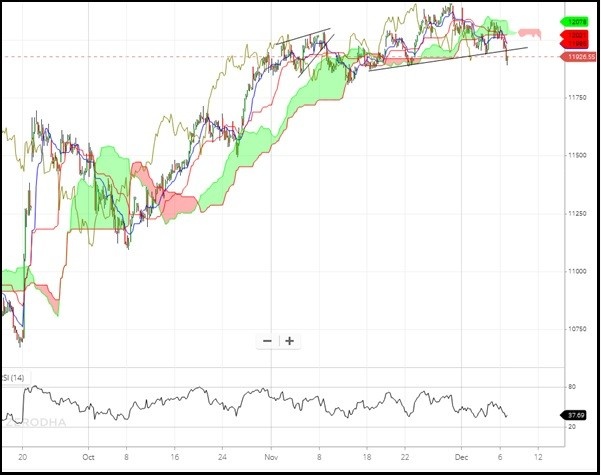
Let us look at the below chart of Nifty and try to understand what has happened in the recent past:
Nifty 60 minutes chart: Ichimoku Cloud
Nifty 60 minutes chart: Bollinger Bands

In the first chart of Nifty you can see that Ichimoku Cloud is taken out on downside which has not happened very often. Also on previous occasions prices only drifted below it to reverse back higher. If this time we see a lower highs and lower lows below the Ichimoku Cloud that will indicate that the wave pattern at the top is complete and the other wave down has started. So seeing the nature of pullback from here is very important.
Bollinger Bands – In 2nd chart of Nifty we can see that Bollinger Bands provided important support on the prior occasions. This time now prices are just at the lower end of the Band and we have to see if there is attempt on upside back towards 12000 levels or not. A strong breakdown below the zone of 11880 – 11850 will be an indication of a trending move to emerge.
So, in a nutshell we are at make it or break it zone. A pullback is the key that will decide if we are still in the trading range or if the key support levels are broken with momentum then the next wave will start that will retrace a portion of the recent rise. Time to be alert!
Subscribe to the daily equity, commodity, stock intraday / positional calls and get access to the research report with advanced concepts of technical analysis applied for free. On annual subscription get 30% flat discount. Know more here


