What is Relative Strength Index (RSI) indicator? Combining with Elliott wave principle!
What is RSI?
The Relative Strength Index (RSI) is a momentum oscillator that measures the speed and change of price movements, which was developed by J. Welles Wilder.
Many people use RSI to understand overbought and oversold state of market but during strong trending moves prices can remain in strong overbought region or oversold region for extended period of time. It therefore become necessary to see if market is in a trending mode or a trading range.
We use RSI along with Elliott wave counts to majorly determine positive or negative divergences between prices and indicator. Whether you use RSI, ROC, MACD, etc most of the indicators will essentially give similar output. Unless you are an expert one can rely on 14 periodicity. A period should be ideally selected based on Time Cycles.
Divergences: A positive divergence occurs when prices make lower low but RSI makes higher low and a negative divergence occurs when prices make higher high but RSI makes lower high thereby indicating the up move is on less momentum and the strength is waning out.
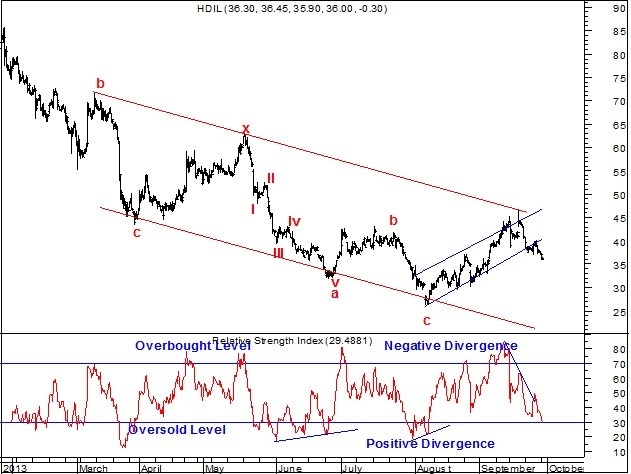
Below we have shown 120 mins chart of HDIL (along with RSI):
HDIL 120 mins chart:

As shown in chart, RSI is signaling positive divergence and negative divergence at a various point of time. This type of signal cautions trader that prevailing trend may change. However, waiting for the positive or negative price confirmation is the key at crucial levels.
Wehave been using RSI in our trading advisory services along with Elliott wave principle. We publish daily research report on Nifty and Equity Stocks which has charts and explanation using various studies. To subscribe visit
https://www.wavesstrategy.com

