How to trade USDINR with Elliott Wave Pattern and Fibonacci
USDINR has shown multi-year long Diametric pattern correction and it looks like a running Bow – Tie Diametric. Post forming high near 75 levels by the end of the year 2018, the pair hasn’t seen any momentum towards the same and drifting lower since then. The fall has been slower and in overlapping fashion from the highs of 75
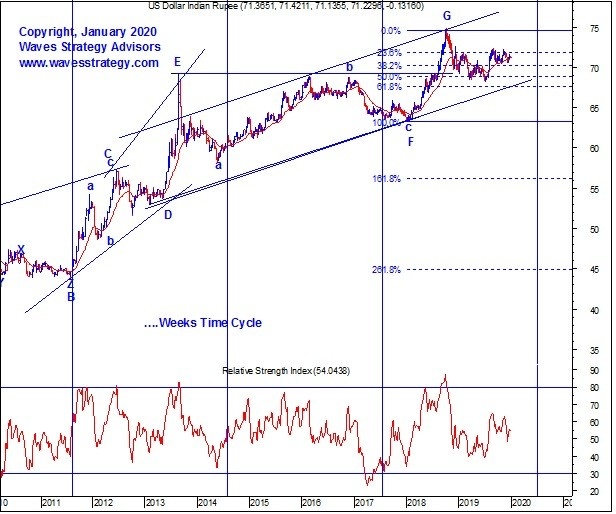
USDINR Weekly chart spot
following was published in the monthly research on 9th July 2019-
Wave Perspective:
As per advanced concept of Elliott wave if the last rising segment is retraced back slower it generally results into complex correction formation involving x waves. This is the reason why we think the fall in USDINR will be limited and eventually the longer term uptrend should start i.e. INR can continue to deteriorate against USD for years to come but over short term we can see some appreciation.
As shown on weekly chart of USDINR, prices are moving precisely within the blue channel which is working extremely well. The lower trendline support is near 67.50 levels and as long as the level of 71 is protected we can expect this pair to drift lower.
As per Elliot wave perspective, wave G of the Diametric pattern completed near the highs of 75 and the fall is in form of wave X. Till now prices have retraced 32.8% of wave G and further we might expect prices will retrace nearly 61.8% which comes near channel support. So post witnessing some consolidation we can see a move eventually lower.
Subscribe to Intraday / Positional advisory on stocks, commodity, and currency markets and get Elliott wave research free along with it. register here
Mentorship: I will be covering these important trade setups that is must in your trading plan in the upcoming Mentorship program. I will be assisting in the trades taken beyond the 3 months mentorship schedule as an ongoing learning for any trader. How to enter and exit in disciplined fashion. Know more here
