What is Neo wave, difference between Elliott wave & Neo wave?
Neo wave is an advanced concept of Elliott wave developed by Glenn Neely.
Neo Waves Theory is an advanced and highly structured development of the classical Elliott Wave Principle, created by Glenn Neely. It was designed to address the biggest limitation of traditional Elliott Wave analysis subjectivity.
To understand Neo Waves Theory, it is important to first revisit the foundations laid by R. N. Elliott in the 1930s.
Origin of Elliott Wave Theory
R. N. Elliott in 1930s observed that stock market prices do not move randomly. Instead, they follow a systematic and repetitive structure, governed by Fibonacci ratios and natural laws of crowd psychology.
According to Elliott:
-
Market movements unfold in waves
-
A complete cycle consists of:
-
5 waves in the direction of the main trend
-
3 corrective waves against the trend
-
-
This creates a net progression, which is clearly visible in long-term stock market behavior
Every price movement can broadly be classified into:
-
Impulsive waves (trend-following)
-
Corrective waves (counter-trend)
Any price movement as per basic Elliott wave is classified into Impulsive and corrective. There are various patterns within these broader heads. Impulsive waves need to follow three basic rules:
- Wave 2 cannot retrace complete of wave 1
- Wave 3 cannot be the shortest of the directional waves 1,3 and 5
- Wave 4 cannot enter into territory of wave 1
The above 3 basic rules if followed then the price movement under consideration can be classified as a normal Impulse wave.
However, when the market structure is complex there is possibility that the movement can be counted in many different ways. This can result into subjectivity and the entire purpose of wave theory can be lost. To overcome this limitation Neo wave was developed that has more than 15 different rules to define a simple impulse pattern. Following are a few of them:
- Wave 2 cannot retrace more than 61.8% of wave 1
- Wave 3 cannot be the shortest of the directional waves 1,3 and 5
- Wave 4 cannot enter into territory of wave 2
- There has to be at least one extended wave which is going to be 1.618% of non extended wave. If there is no extension then the pattern under consideration is corrective
- One of the directional waves should subdivide
- Corrective waves should consume more time than the preceding impulsive wave
- Touch point rule: Out of 6 points not more than 4 points should lie on the channel
The above shows only a few set of rules for an impulse pattern as defined by Neo wave. There are newly developed patterns as well which were never a part of original Elliott wave. To name a few are:
– Neutral Triangle
– Extracting Triangle
– 3rd Extended Terminal with 5th Failure
These new patterns are equally important to understand because majority of the movement seen in the world equity markets are taking the forms of these patterns that were never covered in original work of R. N. Elliott
We take a step ahead and combine this complex study of Neo wave to that of Time cycles. It is not always that both the studies will be in sync but when they are indeed suggesting the same outcome that is the time that the trade setup is of very high accuracy and it just leaves only one probable outcome.
These are the times when one can go all in with prudent risk and money management strategies which have the potential to give the best of the returns in shortest amount of time.
Below part of research was shown on 4th March 2016 monthly report when Nifty made a low near 6825 levels on Budget day:
Figure 2: Nifty Weekly Time cycle chart (shown on 4th March 2016 monthly research report)
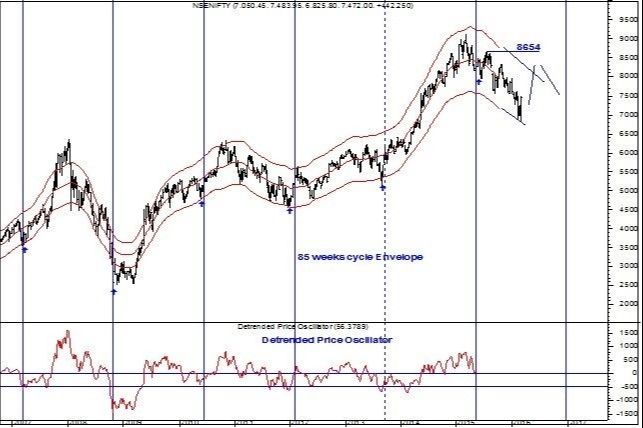
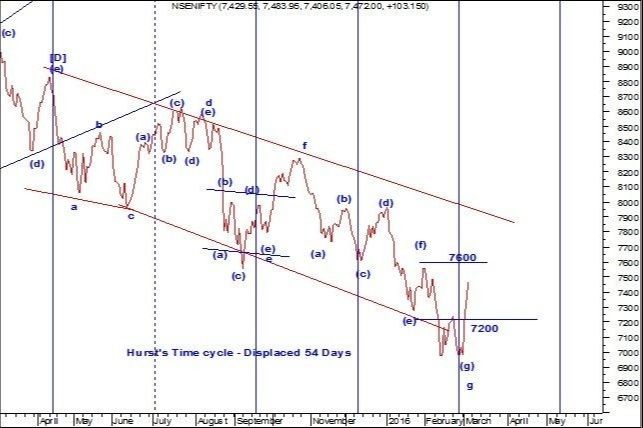
Figure 3: Nifty daily chart (shown on 4th March)
Diametric Pattern in Neo Waves Theory: Confirming Trend Shifts with Time Cycles
One of the most powerful additions under Neo Waves Theory is the Diametric Pattern, which plays a crucial role in identifying the completion of complex corrective phases that are often misread under orthodox Elliott Wave analysis.
As highlighted in Figure 3, the Diametric pattern clearly showed the completion of wave g of (g). What strengthened this conclusion further was the speed of retracement of the preceding down leg. The decline was retraced in much faster time, which is a key Neo Wave confirmation that the corrective structure from 8340 had likely ended.
This time-based validation is extremely important in Neo Waves Theory, as price alone is never sufficient time symmetry and retracement behavior must also align.
Early Confirmation and Real-Time Market Validation
An interim update was published on 1st March, immediately after the 7100 level was broken. From that point, the market responded sharply, with NIFTY 50 rallying more than 400 points in just three trading sessions.
Such rapid follow-through after a breakout strongly validates:
-
Completion of a corrective structure
-
Transition into a new trending phase
-
Shift in underlying market dynamics
At this stage, instead of attempting to predict tops, the prudent approach was to stay with the trend using a trailing stop-loss method, as mentioned in the daily short-term updates. This ensured profits were protected while remaining positioned for further upside.
Channel Breakout and Change in Market Dynamics
From a structural perspective, there was a high probability of price breaking above channel resistance in the 7750–7800 zone. Given the evolving market behavior, the possibility of crossing above 8000 also increased significantly.
What made this move more reliable was the confirmation from volume-based indicators:
-
Volume Moving Average
-
Volume Rate of Change (ROC)
These indicators signaled a subtle but meaningful shift in participation, which is often invisible to the majority of market participants relying solely on price patterns.
As a result, strategies that worked during the previous one-year downtrend were no longer optimal. The market environment had changed, and upside surprises became more probable than downside shocks.
In a nutshell, there is high possibility that the trend might break above the channel resistance as well near the level of 7750 - 7800 and might cross above 8000 as there is change in market dynamics. Volume MA, Volume ROC also confirms this subtle shift which might not be visible to majority. The methods that worked previously during the downtrend of past one year might require tweaking and the surprises will be on upside. Looking at weekly Time cycle there is high
possibility that we might not be able to cross above 8654 top in 2016 and there can be a higher low formation either in form of intermediate wave 2 or second standard correction. For now the trend is firmly positive as long as 7000 zone is protected and do not try to catch a top in this fast moving market.
The above gist simply shows the power of combining Neo wave with Time cycles.Nevertheless, we were keen on expecting an impulsive rise from 6825 but the entire rise came in form of overlapping pattern and so one need to keep measuring wave patterns against expected outcome.
References are taken from The Financial Waves short term update daily research report which covers Nifty, Bank Nifty and stocks on rotational basis and The Financial Waves Monthly update that shows medium to long term perspective on Nifty, INR Pairs, Global Markets, Gold, other commodities. For subscription options visit Pricing Page
Attend the most Advanced Technical analysis training on Application of Neo wave and Time cycles with practical charts for portfolio creation, stock selection and trade setups. This training will focus on the above methods along with lot of other studies which can be combined together to produce very high conviction trade setups. Register NOW as limited seats available. For more details Contact US or write to us at helpdesk@wavesstrategy.com or call us at +91 22 28831358 / +91 9920422202
