Why Fibonacci projections and retracements is important in trading!
Fibonacci retracement is one of the best techniques which is being used in Technical Analysis for finding the projections and retracement of price movements.
The importance of this technique is
that one can at least do the projection of the price from where the reversal is
possible, hence one can trade accordingly using mentioned technique along with
other technical tools.
Founder of Fibonacci Numbers:
Leonardo Fibonacci was an Italian mathematician,
considered by some “the most talented western mathematician of the Middle
Ages who founded relationship between the numbers. The Fibonacci series is a
numerical sequence comprised of adding the previous numbers together, i.e. (1,2,3,5,8,13,21,34,55,89,144,233
etc..). An interesting property of these numbers is that as the series
proceeds, any given number is 1.618 times the preceding number and 0.618% of
the next number. This ratio is called as golden
ratio.
Definition of ‘Fibonacci Retracement:
A term used in technical analysis
that refers to areas of support (price stops going lower) or resistance (price
stops going higher). The Fibonacci retracement is the potential retracement of a financial asset’s original move
in price. Fibonacci retracements use horizontal lines to indicate areas
of support or resistance at the key Fibonacci levels before it continues in the
original direction. These levels are created by drawing a trend line between
two extreme points and then dividing the vertical distance by the key Fibonacci
ratios of 23.6%,
38.2%, 50%, 61.8% and 100%.
We have been using Fibonacci retracement along with Elliott wave counts
and various other technical tools to catch the next major price movements in
financial assets.
Below is excerpt of our research
report picked up from the The
Financial Waves STU Daily Report which is published on daily basis
before market opens:
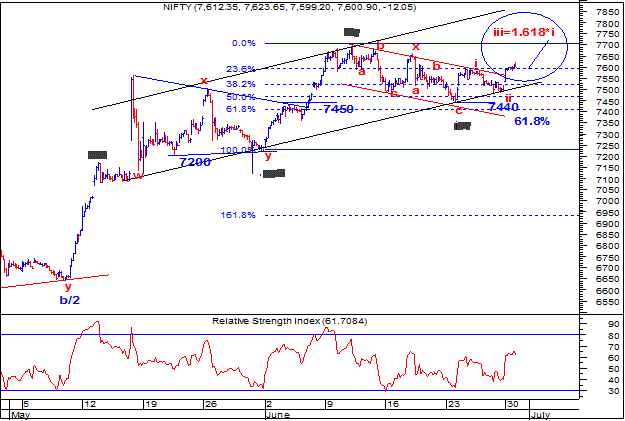
Nifty 60 mins chart: (Published on 1st July
2014)

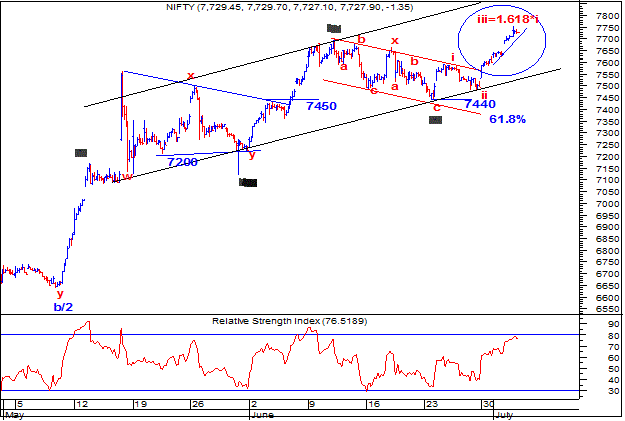
Happened: as of 3rd July
2014 12:00 pm

Wave Analysis:
Picked up from
research report dated 1st
July 2014, On smaller degree, Nifty 60 mins chart shows a clear breakout from the
short term red channel which was intact for 13 trading days. Also after hitting
7700 index failed to show higher highs higher low formation but yesterdays up move confirms reversal as per this technique. The
internal legs of wave v shows that prices are in minute wave iii of v which can
move towards 7750 where wave iii will be
equal to 1.618 * wave i. On upside, the
rally can now continue towards 7750
7800 levels.
Happened: Nifty touched intraday
high of 7754 in todays morning trading session.
This simply shows the power of Elliott wave combined together with
Fibonacci Projections and retracement.
Along with this, we have published daily
chart of Nifty with Elliott wave Counts and Fibonacci projection which is
providing vital clues for the future action of the price.
To get full research on Nifty and 3
stocks along with charts and detailed explanation subscribe to our daily
research report The Financial Waves Short term update.
You can pay online and we will instantly start your subscription.
Useful for: Learning Fibonacci projections, Equity market analysis
using advanced technical analysis
Related to: Fibonacci projections,
Fibonacci retracement, Technical analysis, Nifty Fibonacci retracement, Golden ratio, Elliott
wave

