LT: Bollinger Bands®, Elliott wave pattern, Moving averages
Technical analysis is the vast subject and it has different kinds of techniques to understand the trend of any asset class. The concepts like trendlines, moving averages, Bollinger Bands are the basic ones but it is very important to use all these indicators along with advanced technical tools like Elliott wave theory to determine the trend.
Larsen and Toubro stock price has been trading in the form of higher high and higher low since past 4 sessions which indicates positive bias as per simple bar technique.
Along with this simple bar technique we had Bollinger Bands, Channels & Elliott Wave theory explaining the up move.
The stock was covered in the morning daily research report – “The Financial Waves short term update” on 20th October 2020.
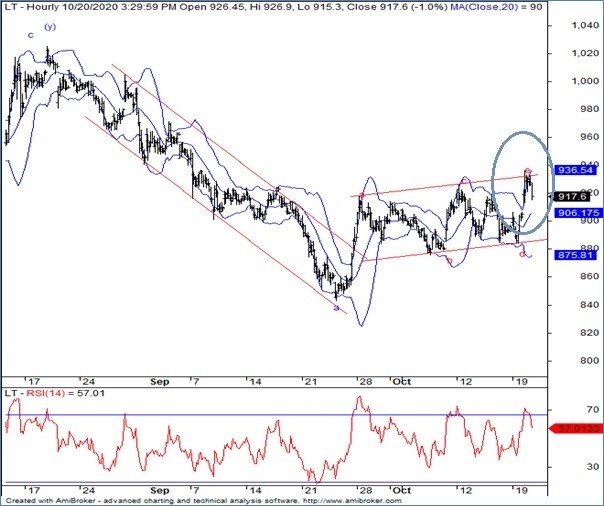
LT 60 minutes chart: (Anticipated as on 20th October 2020)
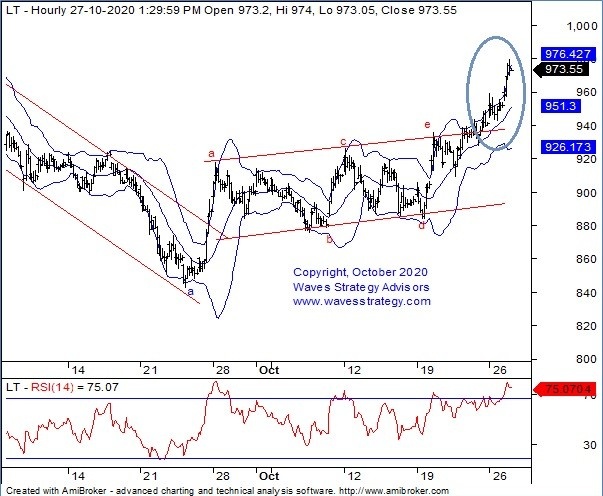
LT 60 mins chart: (Happened as on now)
Wave Analysis: Following was mentioned on 20th October
As shown on daily chart, LT once again managed to close above its prior bar’s high but with a Doji candle, looks like the traders are still figuring out about the emerging up move. Prices after a long time broke above the 55-Days EMA decisively on closing basis and now it would be important to see if it sustains above the same in coming session which would further validate the emerging trend on the upside. Wave counts suggest to be moving in wave (B) in complex correction. Within which wave (x) is in progress.
As shown on the hourly chart, we have shown the Bollinger Bands wherein we can see the stock is tearing outside the lower Bollinger band for couple of hours. Prices have a tendency to enter back inside the Bollinger band after a period of overextended move in a particular direction; hence buying may emerge if able to give breakouts of its upper Bollinger band again. As per wave counts wave b blue is progress in the form of diametric pattern.
In short, LT has continued to trade in the positive zone. Now move above 935 will confirm the uptrend and open up gates for higher levels towards 960. As far as 900 remains intact on the lower side.
Happened: The stock moved exactly as mentioned Bollinger Bands gave bullish breakout signal. In the today’s session the stock was up by more the 3% and made an intraday high near 979 levels. This analysis ensures that Elliott wave patterns combined with indicators can help in gauging the directional moves.
There is more to it including index, short term chart with Elliott wave counts. “The Financial Waves Short Term Update in-depth research on Nifty and 3 stocks with various important trend identifying indicators with Elliott wave. For subscription Register here
Mentorship starting from November 2020: I will be discussing all of the above methods on how to identify patterns and combine them with important indicators and Elliott wave, Neo wave theory, Hurst’s Time cycles. The course will cover a lot more topics with practical charts, real life examples, actual trades on Equity markets and much more. Only limited seats, Register now
