Nifty Applying Time Cycles on 15 Minutes and 5 Minutes Chart
Time Cycles is a powerful Technical analysis study that can give a very clear reversal areas to traders.
Ever happened that even after knowing the trend it is difficult to make money because the timing was off by just an hour? Here is the solution to the problem. Time the trade precisely to the very minute.
Now look at the below charts of Nifty on a 15 minutes and 5 minutes time frame. Also keep in mind both the charts shows a synchronized time behavior.
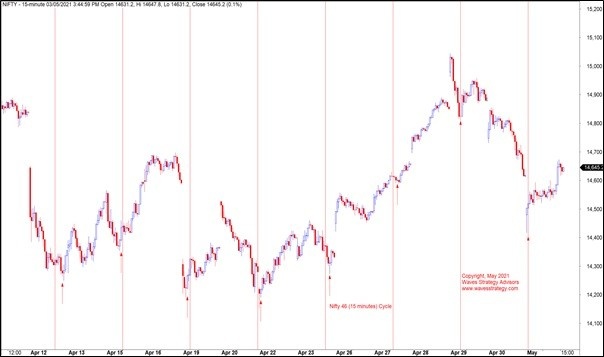
Nifty 15 minutes Chart (46 period Time cycle)
Nifty 5 minutes Chart (64 period Time Cycle)

Above chart clearly highlights areas of reversal and again these are not big time frame charts but 15 minutes and 5 minutes. Now this can be an eye opener for every trader that news or events are not responsible for the movement of market but the market behaves the way it has to and news will align itself along with it.
Nifty 15 minutes chart shows 46 period Time cycle – we can clearly see that every 46 period with a few candles leeway prices reverses the trend from down to up. It has happened so precisely on many occasions to the very period and it clearly suggest that by knowing this information a trader can align his / her existing studies with Time period and enter the market exactly when it is supposed to reverse.
To make it more precise let us now drill down to a 5 minutes chart
Nifty 5 minutes chart shows 64 period Time Cycle – Turn in prices is not only limited to 15 minutes time frame but also to a 5 minutes chart. In above chart we have shown a clear reversal in trend every 64 candles. Even the recent low near 14415 was exactly on this time cycle period. Thrilled yet! Imagine the drastic rise in accuracy if one is aware about this simple concept of Time Cycles and learn the application of the same right to a 5 minutes chart.
In a nutshell, as long as 15 minutes cycle low near 14415 is protected prices can show range bound movement with a positive bias whereas break below 14415 will suggest cycles are entering into a sell zone.
3 Months Mentorship on Timing the Markets November 2021 - Learn to time the market and trade with me for the period of 3 Months including Live trading, stock selection, Momentum, and Multibagger stock identification, Timing the entry to the very Day, Hour, and Minute using Time cycles and Elliott Wave analysis. Early Bird ends on 25th October 2021. Get access to MOC as soon as you register for Mentorship, Contact +919920422202 for more details. Here is the path to become a successful trader
“Timing the Markets using Cycles and CandleSticks Excellent WAVES of- mind management explained,patience,science, time cycle & predictability ,destiny of market, momentum methods,mentorship,risk management” – By Pankaj N Tardeja
“Amazed by the time cycles how they exactly coincide with the important political and financial events. Awestuck when realizing that we can even predict when would be the next event that drives major changes in the stock market. More importantly, you have made it so simple to understand this complicated topic. Thank you!” – By Sreedhar Yeleswarapu
