5 powerful indicators on Bank Nifty (That actually work)
Bank Nifty has been exhibiting classical trading opportunity even if simple techniques like Moving average, Channels and RSI is being applied.
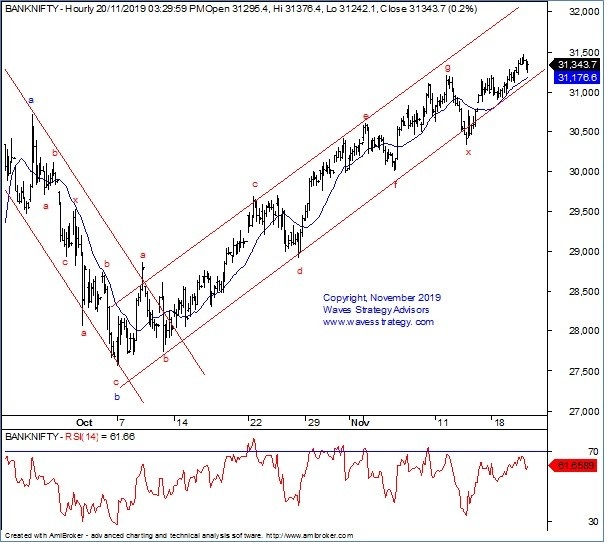
Since the second week of October 2019, the index has been forming higher highs and higher lows. This is the most basic but important method as per Dow Theory that confirms the direction of the trend.
However, we also have to keep a track if the upside move is losing steam by using any momentum indicators like RSI, ROC or any that suits your trading style.
I personally use RSI in order to identify if there is a positive or negative divergences which hints if the trend is maturing. Now see the below chart of Bank Nifty
Bank Nifty 60 minutes chart:
Following are the 5 powerful indicators. This might look common but if enough attention is paid it will provide important information that will help in increasing the trading accuracy.
– Dow Theory: Trend remains positive as long as there is higher highs and higher lows formation. So look for buying opportunity provided other indicators are in sync
– Channels: Lower trendline of channel provides buying opportunity whereas the upper trendline acts as resistance. So one should avoid buying near the upper resistance line and look at price action near the channel support.
– Moving average: Use the moving average that has been working well. Not the predefined ones. An average that provides the support is the best one to use. It again helps in providing an entry level as prices crosses above it but price pattern is equally important.
– RSI: Now momentum indicator plays vital role to see if the trend is maturing. RSI has been exhibiting negative divergence and so one should be little cautious now. This happens when prices are rising with a slower pace.
– Elliott wave pattern: Identifying the wave counts and pattern is the key before pulling the trigger. Bank Nifty is moving higher after completing wave x.
Now given the above information how to derive the trade setup?
As per Dow Theory, Channels and Moving average prices are in buy trend for positional trade perspective. On intraday there can be both long and short opportunity. So it is important to see the chart as per the time frame of your trades. See more applications of these methods here
As per momentum indicator RSI longs should be cautious as there is slower momentum in rising segment and wave theory is suggesting we might be completing wave a if the trendline support breaks and show minor reversal. Learn to apply Elliott wave theory in practice.
So, there are signs of caution and we cannot expect very strong move unless the resistance level near 31500 is taken out on closing basis. It is better to look at other indices or stocks where all of the above indicators are in sync and not providing contrarian indications. Once the indicators get aligned there will be the perfect trade setup that should not be missed. As a trader one needs to wait for the setup and then do not hesitate to pull the trigger with a strict stoploss and expected targets!
Nifty has also provided very clear Elliott wave structure applied with Average True range!
So, How to apply the above simple tools and build a powerful trading system with scanners for intraday and positional trades? Here is opportunity to make the best investment so far. Mentorship on Timing the Market November 2021 – check here how to become an expert trader
Get access to the research reports and call tips directly on whatsapp with clearly defined stoploss and targets along with detailed charts
