
360 ONE: Gann Square of 9 & KST Reveals the Next Move?
Aug 04, 2026
Markets leave footprints before every major move. The key is knowing how to read them. While Gann Square of 9 helps identify important price levels, KST reveals whether momentum is supporting the trend. Let's understand the chart of 360 One Wam Ltd and see what these two powerful tools are indicating for the stock's next move.
When we combine Simple price action along with Gann square of 9, it helps to form powerful setups with accuracy.
360 ONE Weekly chart with Gann Square of 9
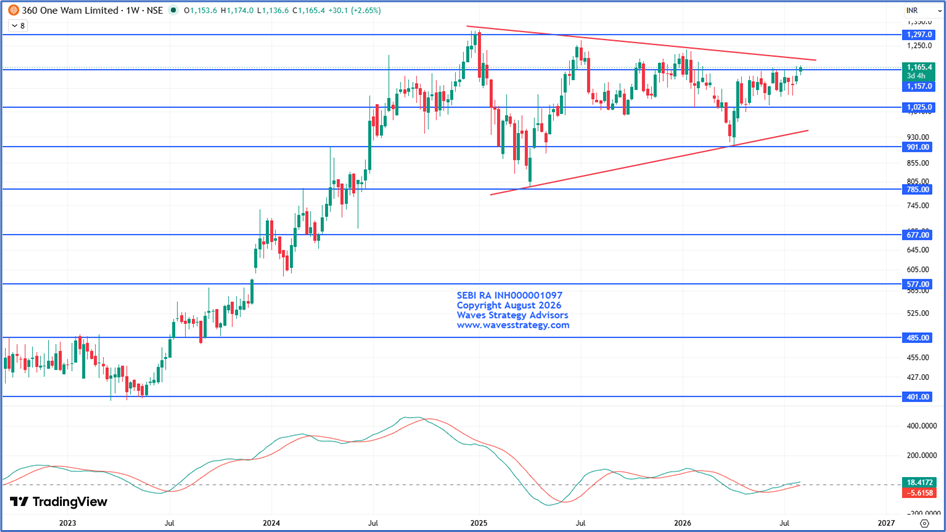
Gann Square of 9 and Price Action
- The Gann Square of 9 is a simple yet powerful tool for identifying key support and resistance levels, based on the principle that price moves in mathematical harmony. Certain levels act as magnets until they are decisively broken.
- This helps a trader in identifying probable price targets and even market turning points.
- 1157 Gann level has acted as a strong resistance, with the stock trading around this level since 20th April 2026.
- In today's session, the stock surged nearly 2% and broke above the 1157 Gann level, indicating renewed bullish momentum.
- This breakout above 1157 level strengthens the positive outlook and also suggests the stock could continue moving higher.
Conclusion
- For now, break above day high of 1174 can be considered as a buying opportunity to participate in the ongoing uptrend.
- The next key resistance is placed at the 1297 Gann level with support being around 1025 level.
Brahmastra Mentorship – Learn the Science of Timing the Market
Master the practical application of Elliott Wave, Neo Wave, Time Cycles, market timing, stock selection, risk management, and professional trading strategies through our comprehensive three-month Brahmastra Mentorship Program.
Fill in the form below to receive complete program details.