How to Catch Momentum Using Rounding Bottom combined with Bollinger bands?
May 09, 2025
When combining basic price patterns with technical indicators like Bolling Bands and Volume, it can lead to remarkable results in trading. Check out how KPRMILL LTD rallied by more than 9% in a single trading session after our report was published.
It's impressive how combining these simple indicators with price patterns can pinpoint momentum stocks for short-term trades, leading to substantial returns
We published the following research on KPR MILL Ltd on 09th May 2025 in the “Vayu Momentum Report” which our subscribers receive pre-market every day.
KPRMILL Daily chart Anticipated on 09th May 2025
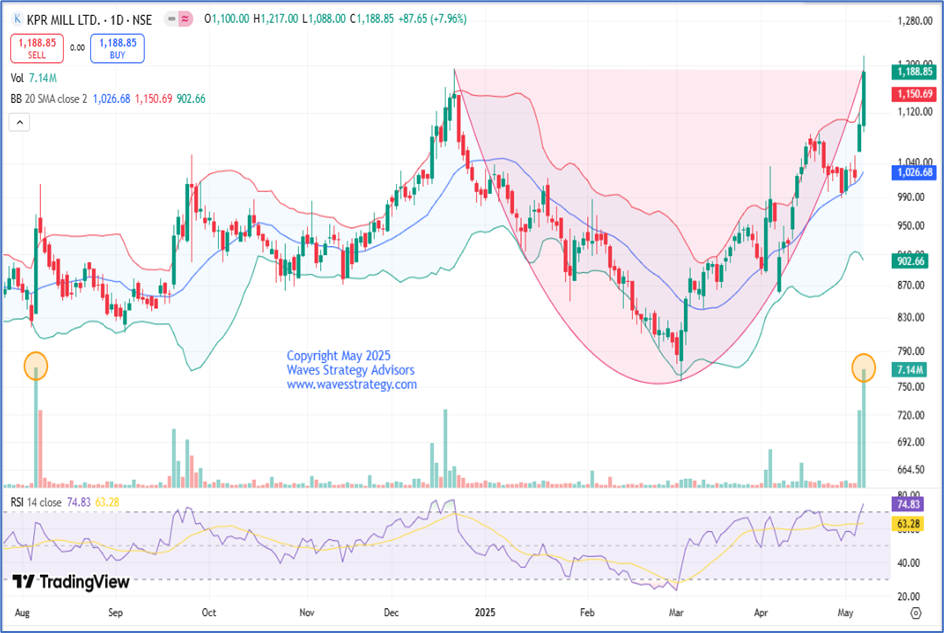 Wave Analysis on 09th May 2025:
In the previous session, KPRMILL jumped by nearly 8% with significant rise in the volume which is the highest volume post August 2024 and made a life time high of 1217 levels. The stock is under the formation of rounding bottom pattern and trading near its neckline of 1194 levels. A breach of it can result into breakout of the pattern.
Prices have given a breakout of the upper Bands with bands expanding suggesting that positive momentum can continue to be seen. Stock is following 3 candlesticks rules which gives more conviction to our overall view which is on bullish side. However, RSI is trading at the overbought zone so buy on dips looks to be a wise strategy to ride the trend better.
In a nutshell, trend for KPRMILL is bullish. Use dips as a buying opportunity for a move towards 1300 levels as long as 1136 holds on the downside.
Key Resistance: 1300
Key Support: 1136
Strategy: Use dips towards 1155-1160 as a buying opportunity with the targets of 1230 followed by 1270 with the stoploss of 1136 levels.
KPRMILL Daily chart Happened on 09th May 2025:
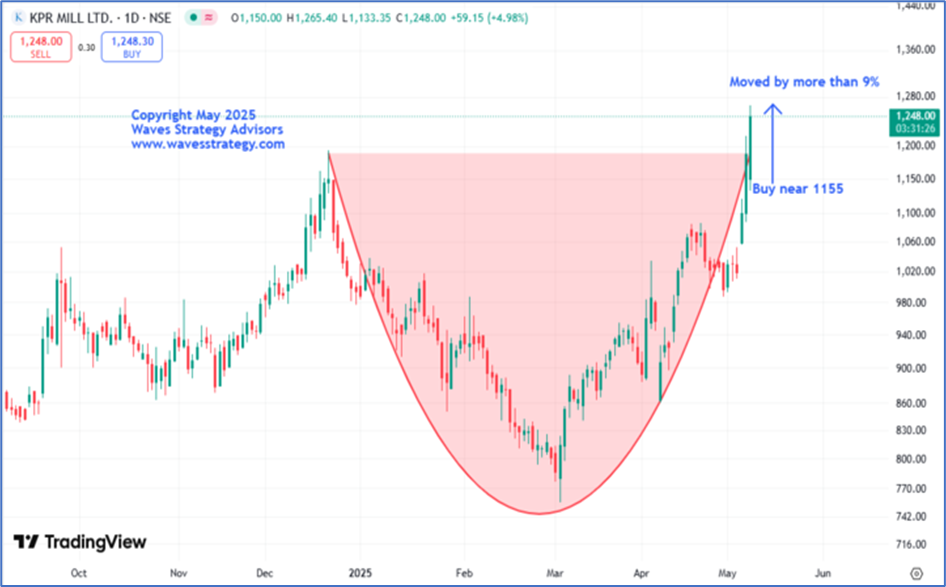 Happened: After we published our report, the stock moved in sync with our expectations. KPRMILL showed a rise of more than 9% in just a single trading session and BANG ON!! The stock managed to achieve our target 1 and made a fresh high near of 1265 levels which was near our target 2 levels. We successfully captured this entire rise by price pattern combined with simple indicator.
It is fascinating to see how accurately combining basic indicators like BollingerBands along with Rounding Bottom can help to predict price targets with accuracy.
Want to know more about such stocks KPRMILL LTD is on the mark! subscribe to our Vayu Short-Term Update: Get a list of stocks with high growth potential: Check Here
Brahmastra (Mentorship) on Timing the market – Equip yourself with tools of Elliott wave, Neo wave, Time cycle, stock selection algo creation, multibagger and momentum stocks identification along with exact trade setup that actually works. Only a few seats left! Fill below form for more details