HDFC Bank Could Be Near a Turning Point - 53-Day Time Cycle Countdown
Dec 18, 2025
Time Cycle analysis is an advanced tool used to time potential market reversals.
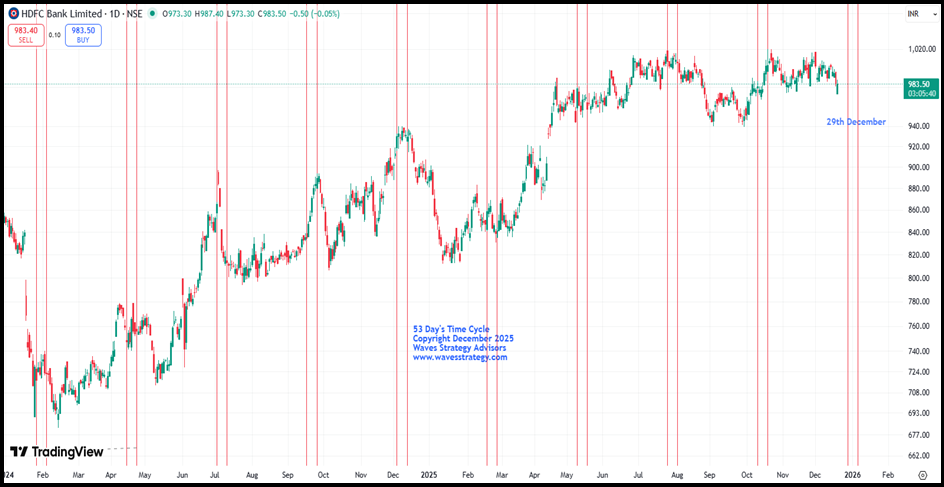
HDFC Bank has been consistently respecting the 53-day Time Cycle, with prices forming major lows whenever the stock approaches this cycle zone. This recurring pattern highlights the effectiveness of time-based analysis and suggests higher probability of upside reversals near the cycle window.
HDFC Bank Daily chart with Time cycle
Time Cycle analysis is an advanced yet often ignored technical tool that focuses on market timing combining with price. It helps traders identify probable reversal zones and capture important lows with better precision.
HDFC Bank has been consistently respecting a 53-day Time Cycle, with most of its meaningful lows forming near these cycle windows, followed by clear upside reversals.
In the current environment, where broader indices and frontline stocks are largely moving in a sideways and trendless manner, HDFC Bank has also remained range-bound. However, the stock is now approaching its next cycle window, due around 29th December 2025. This increases the probability of short-term low formation near the cycle area.
From a price-action perspective, a decisive break above the prior swing high near 1020 will be crucial to confirm that the cycle has turned on the buy side. Until such confirmation, prices may remain under pressure or continue consolidating.
In a nutshell, the combination of Time Cycles and price structure provides strong forecasting ability, making HDFC Bank a stock to watch closely at this important juncture. Once it breaks above 1020 levels fresh course of rally can be seen.
Mentorship Program – Brahmastra (Timing the Markets)
Take your trading mastery to the next level with Brahmastra Mentorship, where you will learn:
- Elliott Wave & NeoWave trading
- Complete Options Trading System
- Time Cycles
- Stock Selection Algorithms
- Practical Market Execution