Is Mahindra & Mahindra on the verge of breakout?
Nov 07, 2025
Does combining Elliott Wave Theory with Time cycle analysis help in creating more powerful trading setups?
Elliott Wave Theory provides exceptional forecasting power, helping to predict market trends across short, medium and long-term horizons. While Time cycle help to understand key turning points in the market.
See the detailed research below on Mahindra and Mahindra Ltd.
Mahindra and Mahindra Ltd Daily chart with Time cycle and Elliott wave
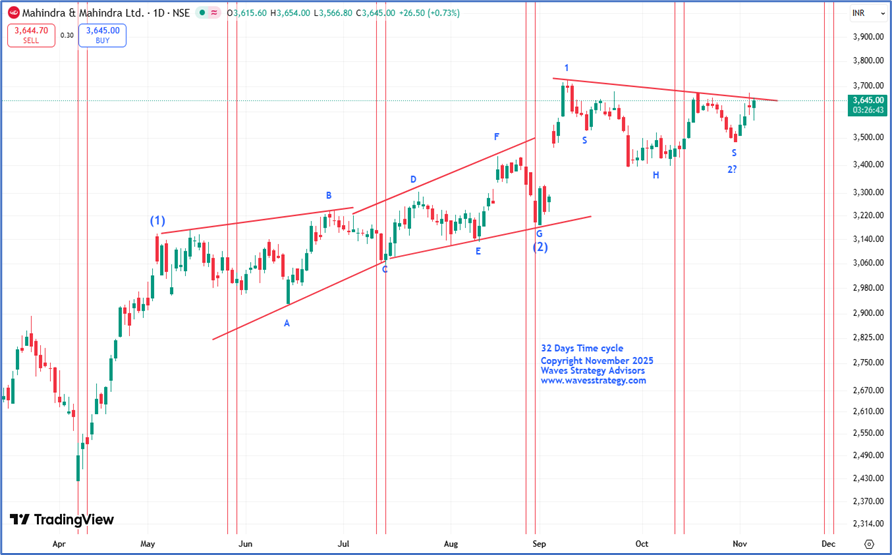
Mahindra and Mahindra Ltd saw effects of its good quarterly results announced on 4th November 2025 which caused the prices to sustain at higher level despite its sector falling which is a strong bullish sign. On the daily chart, stock has been undergoing formation of an inverted head and shoulder pattern since the start of September 2025 on the upper end. For now, prices trading near the neckline of the pattern near 3680 levels and now a decisive break above it can confirm the breakout of the said pattern.
32 Days’ Time cycle - We can see that all the major lows formed on Mahindra and Mahindra Ltd is near 32 Days’ Time cycle from which we have seen a reversal on the upside from time to time. The recent Time cycle was due on 13th October 2025 where prices made low of 3400 levels and currently prices are trading near its previous swing high of 3680 levels and now a decisive break above it can turn the current cycle on the buy side.
As per the wave perspective, wave (2) of Primary degree got completed in the September 2025 in form of Diametric pattern and post which the entire rise has been unfolding in the form of Primary wave (3) which is further subdividing in nature. In which, a break above 3680 levels can confirm completion of internal wave 2 on the downside. Post which, the rise will be in the form of 3 of (3) which is considered the strongest terminus to be part of as per the guidelines.
In a nutshell, Mahindra and Mahindra Ltd is on a verge of a breakout. For now, a break above 3680 levels can trigger a fresh course of rally towards 3940 levels. On the downside, 3480 levels is the nearest support to watch out for!
Trishul Membership –Options Trading with Elliott wave, Neo wave, Ichimoku cloud, and sacred science of trading & forecasting is covered in the Options Mantra Live Sessions - 8th - 9th Nov & Sutra of Waves Live Session - 6th - 7th Dec. Limited seats available.