Muthoot Finance: 3 powerful indicators for trend following.
Aug 23, 2021
Like this Article? Share it with your friends!
We have analyzed Muthoot finance on multiple time frames using wave theory and you can checkout how this stock can be traded over the short term using powerful indicators in the research below.
Muthoot Finance Daily chart as of 20th August 2021:

Muthoot Finance 60 mins chart 20th August 2021:
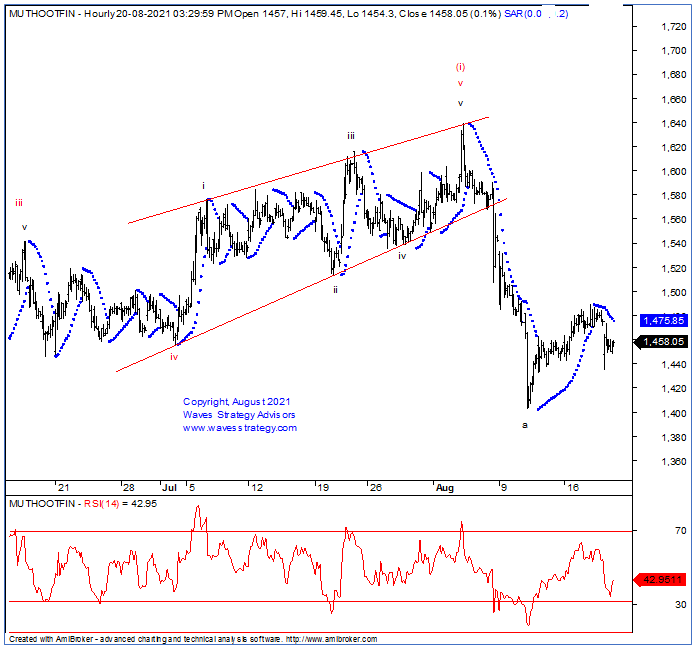
Wave analysis:
Post the sharp fall, Muthoot Finance has retraced from the lows of 1405 to the highs of 1487 levels. In the last session sharp fall was seen which increases the odd that next leg on downside may have started.
The daily chart shows that recent fall has taken out the last leg of rise in faster time which suggest that crucial top has been formed near 1640 levels. From hereon prices are likely to remain in sell on rise mode in form of minor wave (ii). It is back below channel resistance zone and hence on upside 1500-1510 will act as crucial resistance zone. Positional traders can use the 20 SMA to ride the trend on the downside since it has acting as a good resistance level.
As shown in 60 mins chart, wave b may have completed near 1489 levels and wave c may have started on the downside but more price action is required to confirm the same. A break below 1435 can retest 1405 levels. Traders who like to keep a tighter stoploss and want to follow the trend closely can use the parabolic SAR as a trailing stoploss.
In short, Muthoot Finance overall structure remains weak from hereon and broader range will be 1490-1405 level. Use any pullback towards 1465-1470 as selling opportunity with 1490 as resistance and then move towards 1405 levels.
Independence Offer - Get access to Intraday / Positional calls directly on WhatsApp / SMS and receive research report free along with it “The Financial Waves Short Term Update” that contains view on Nifty and stocks that can provide trading opportunity. Get it under the ongoing Independence Day Offer. Subscribe Here
Point is are you ready to equip yourself for identifying such stocks and trade profitably. Learn the science of forecasting using Advanced Elliott Wave, Neo wave and Time the entry using Hurst’s Time Cycles. Take the step towards becoming a successful trader and trust me it is Simple and I will break it down in a way that you cannot miss learning it. Master of Waves (MOW) Season 2.2 Live Event, Limited Seats Only, Early Bird Ends In 2 Days. Fill the form below for more details: