Nifty 55-Day Time Cycle & NeoWave Research: Advanced Elliott Wave Forecasting Explained
Dec 09, 2025
Nifty Advanced Elliott Wave analysis using NeoWave, also known as the GPS of the market, helps us understand the most probable path that price can follow. When this powerful structural forecasting method is combined with time cycle analysis, it allows us to identify not only directional clues but also zones of probable time reversal with a high degree of accuracy.
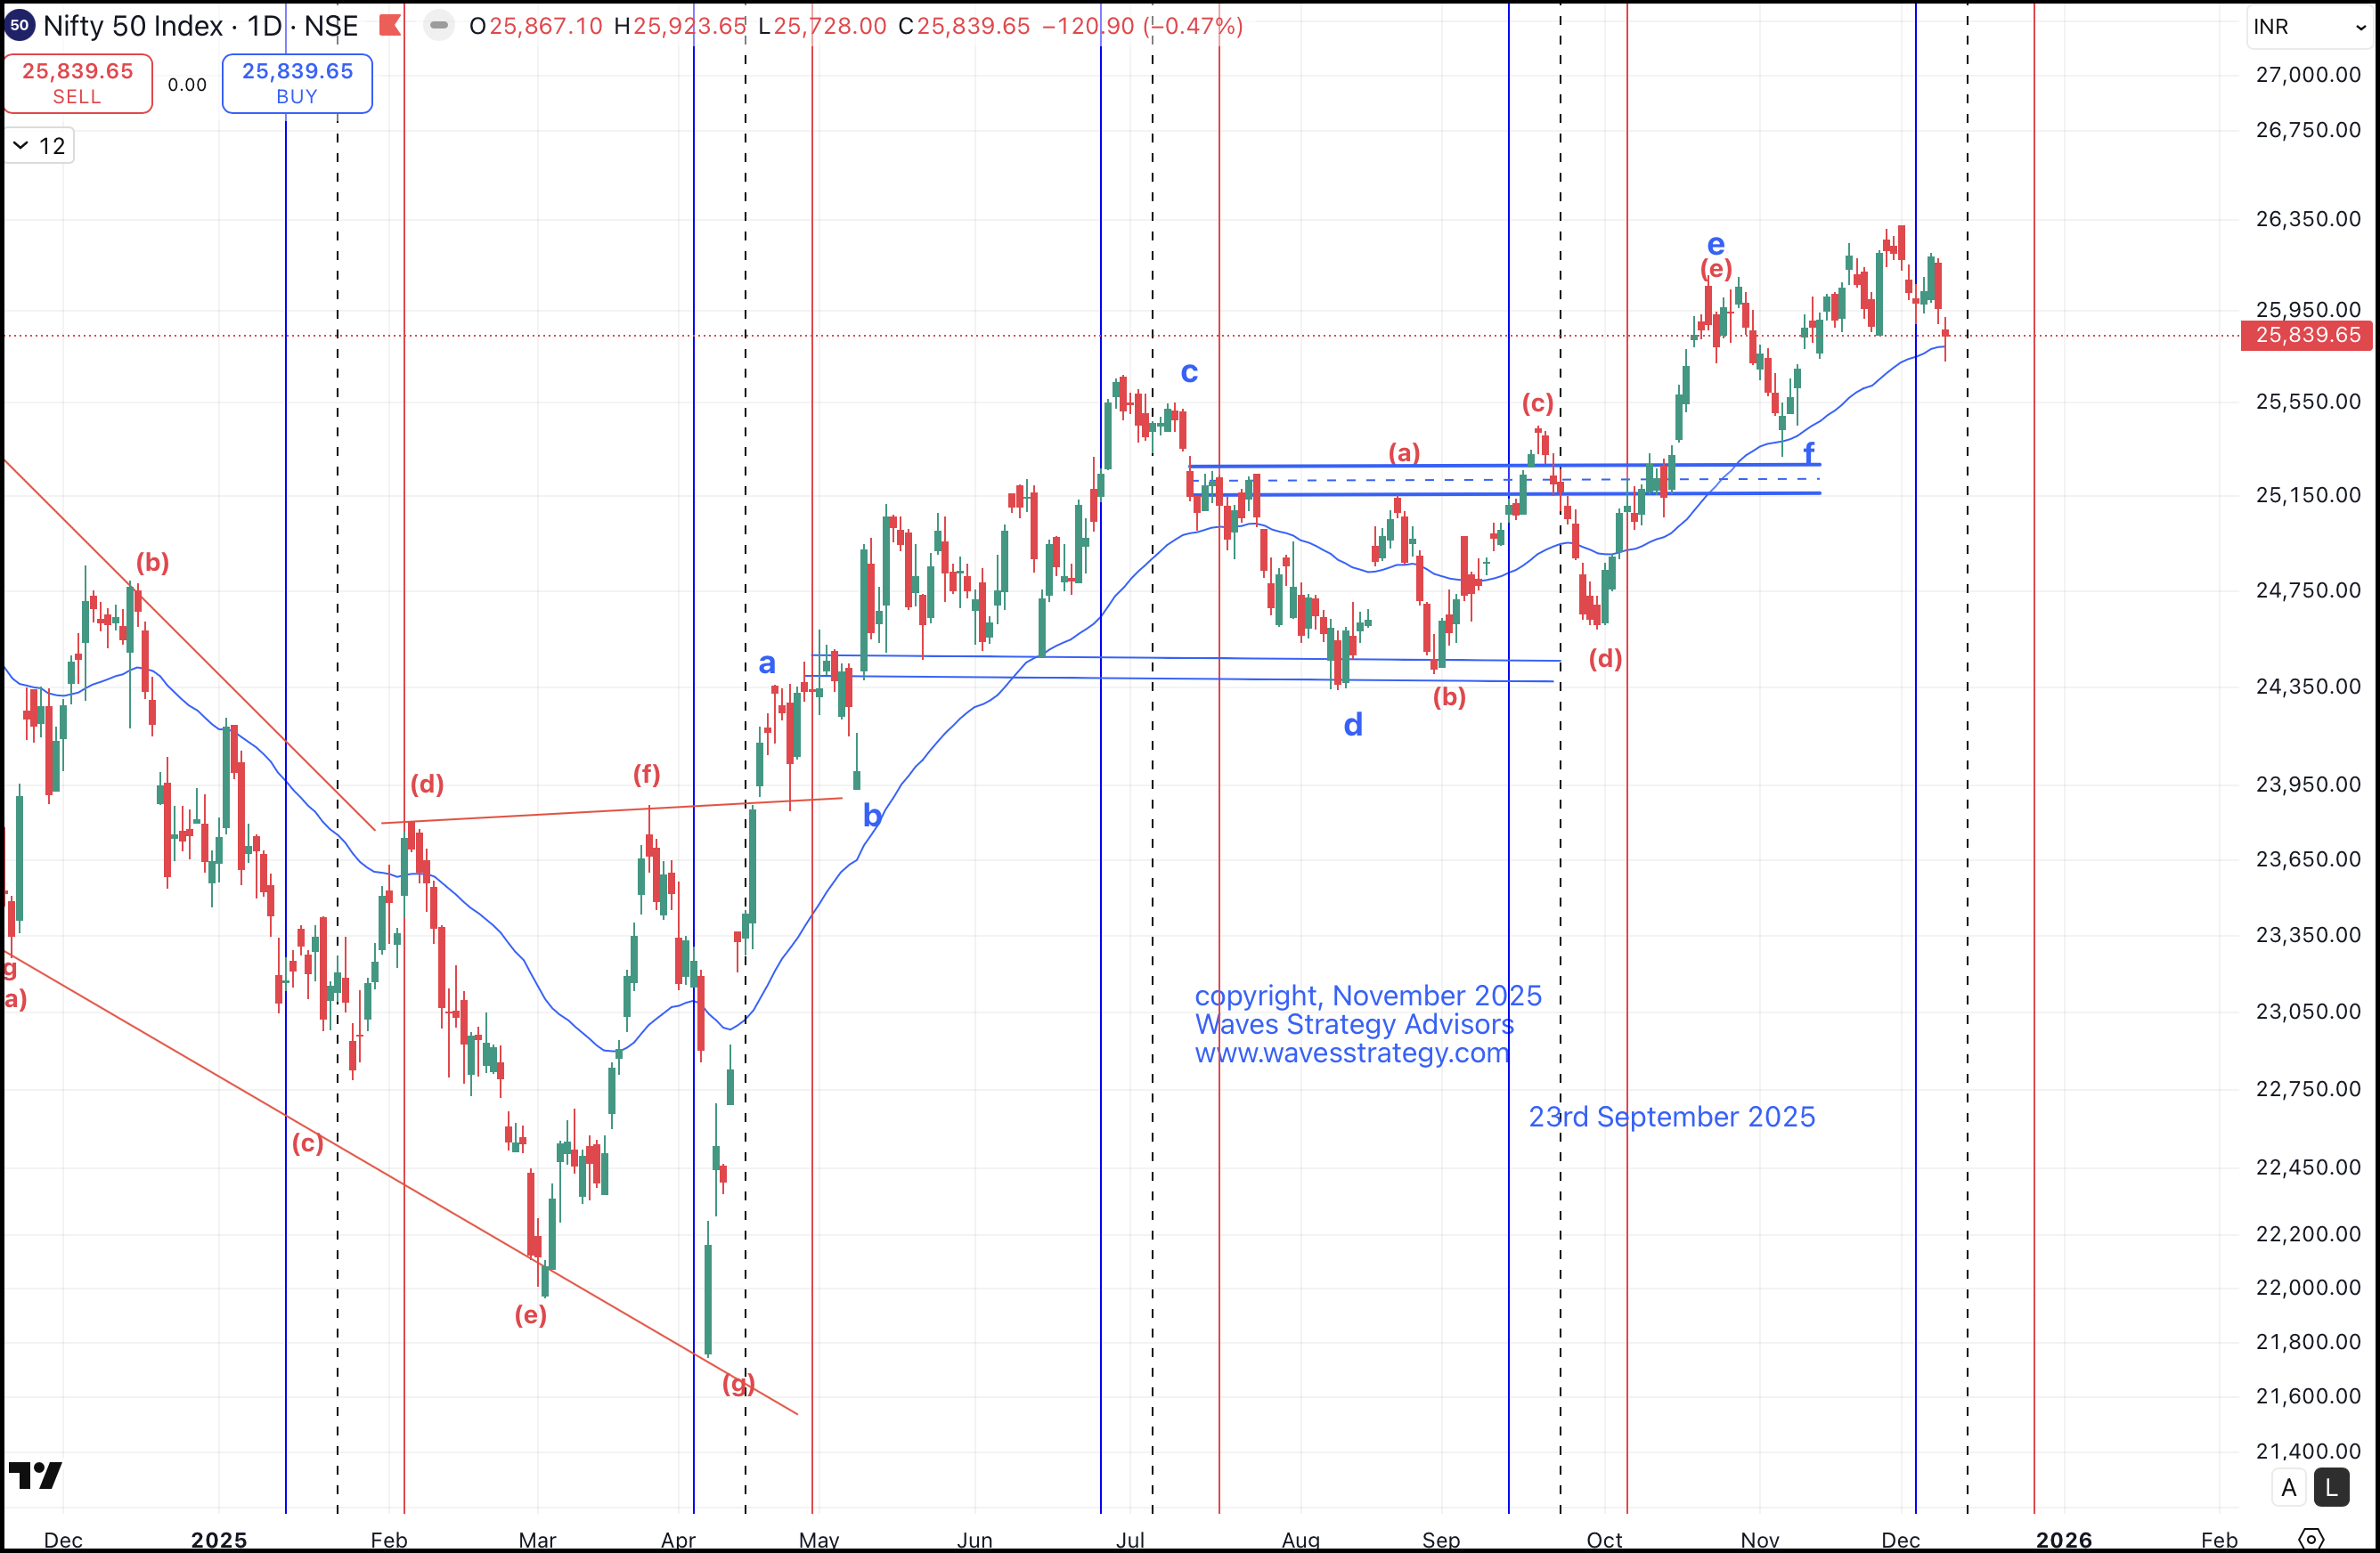
Below is the chart showing the daily NeoWave count along with the 55-day time cycle.
Nifty daily chart:
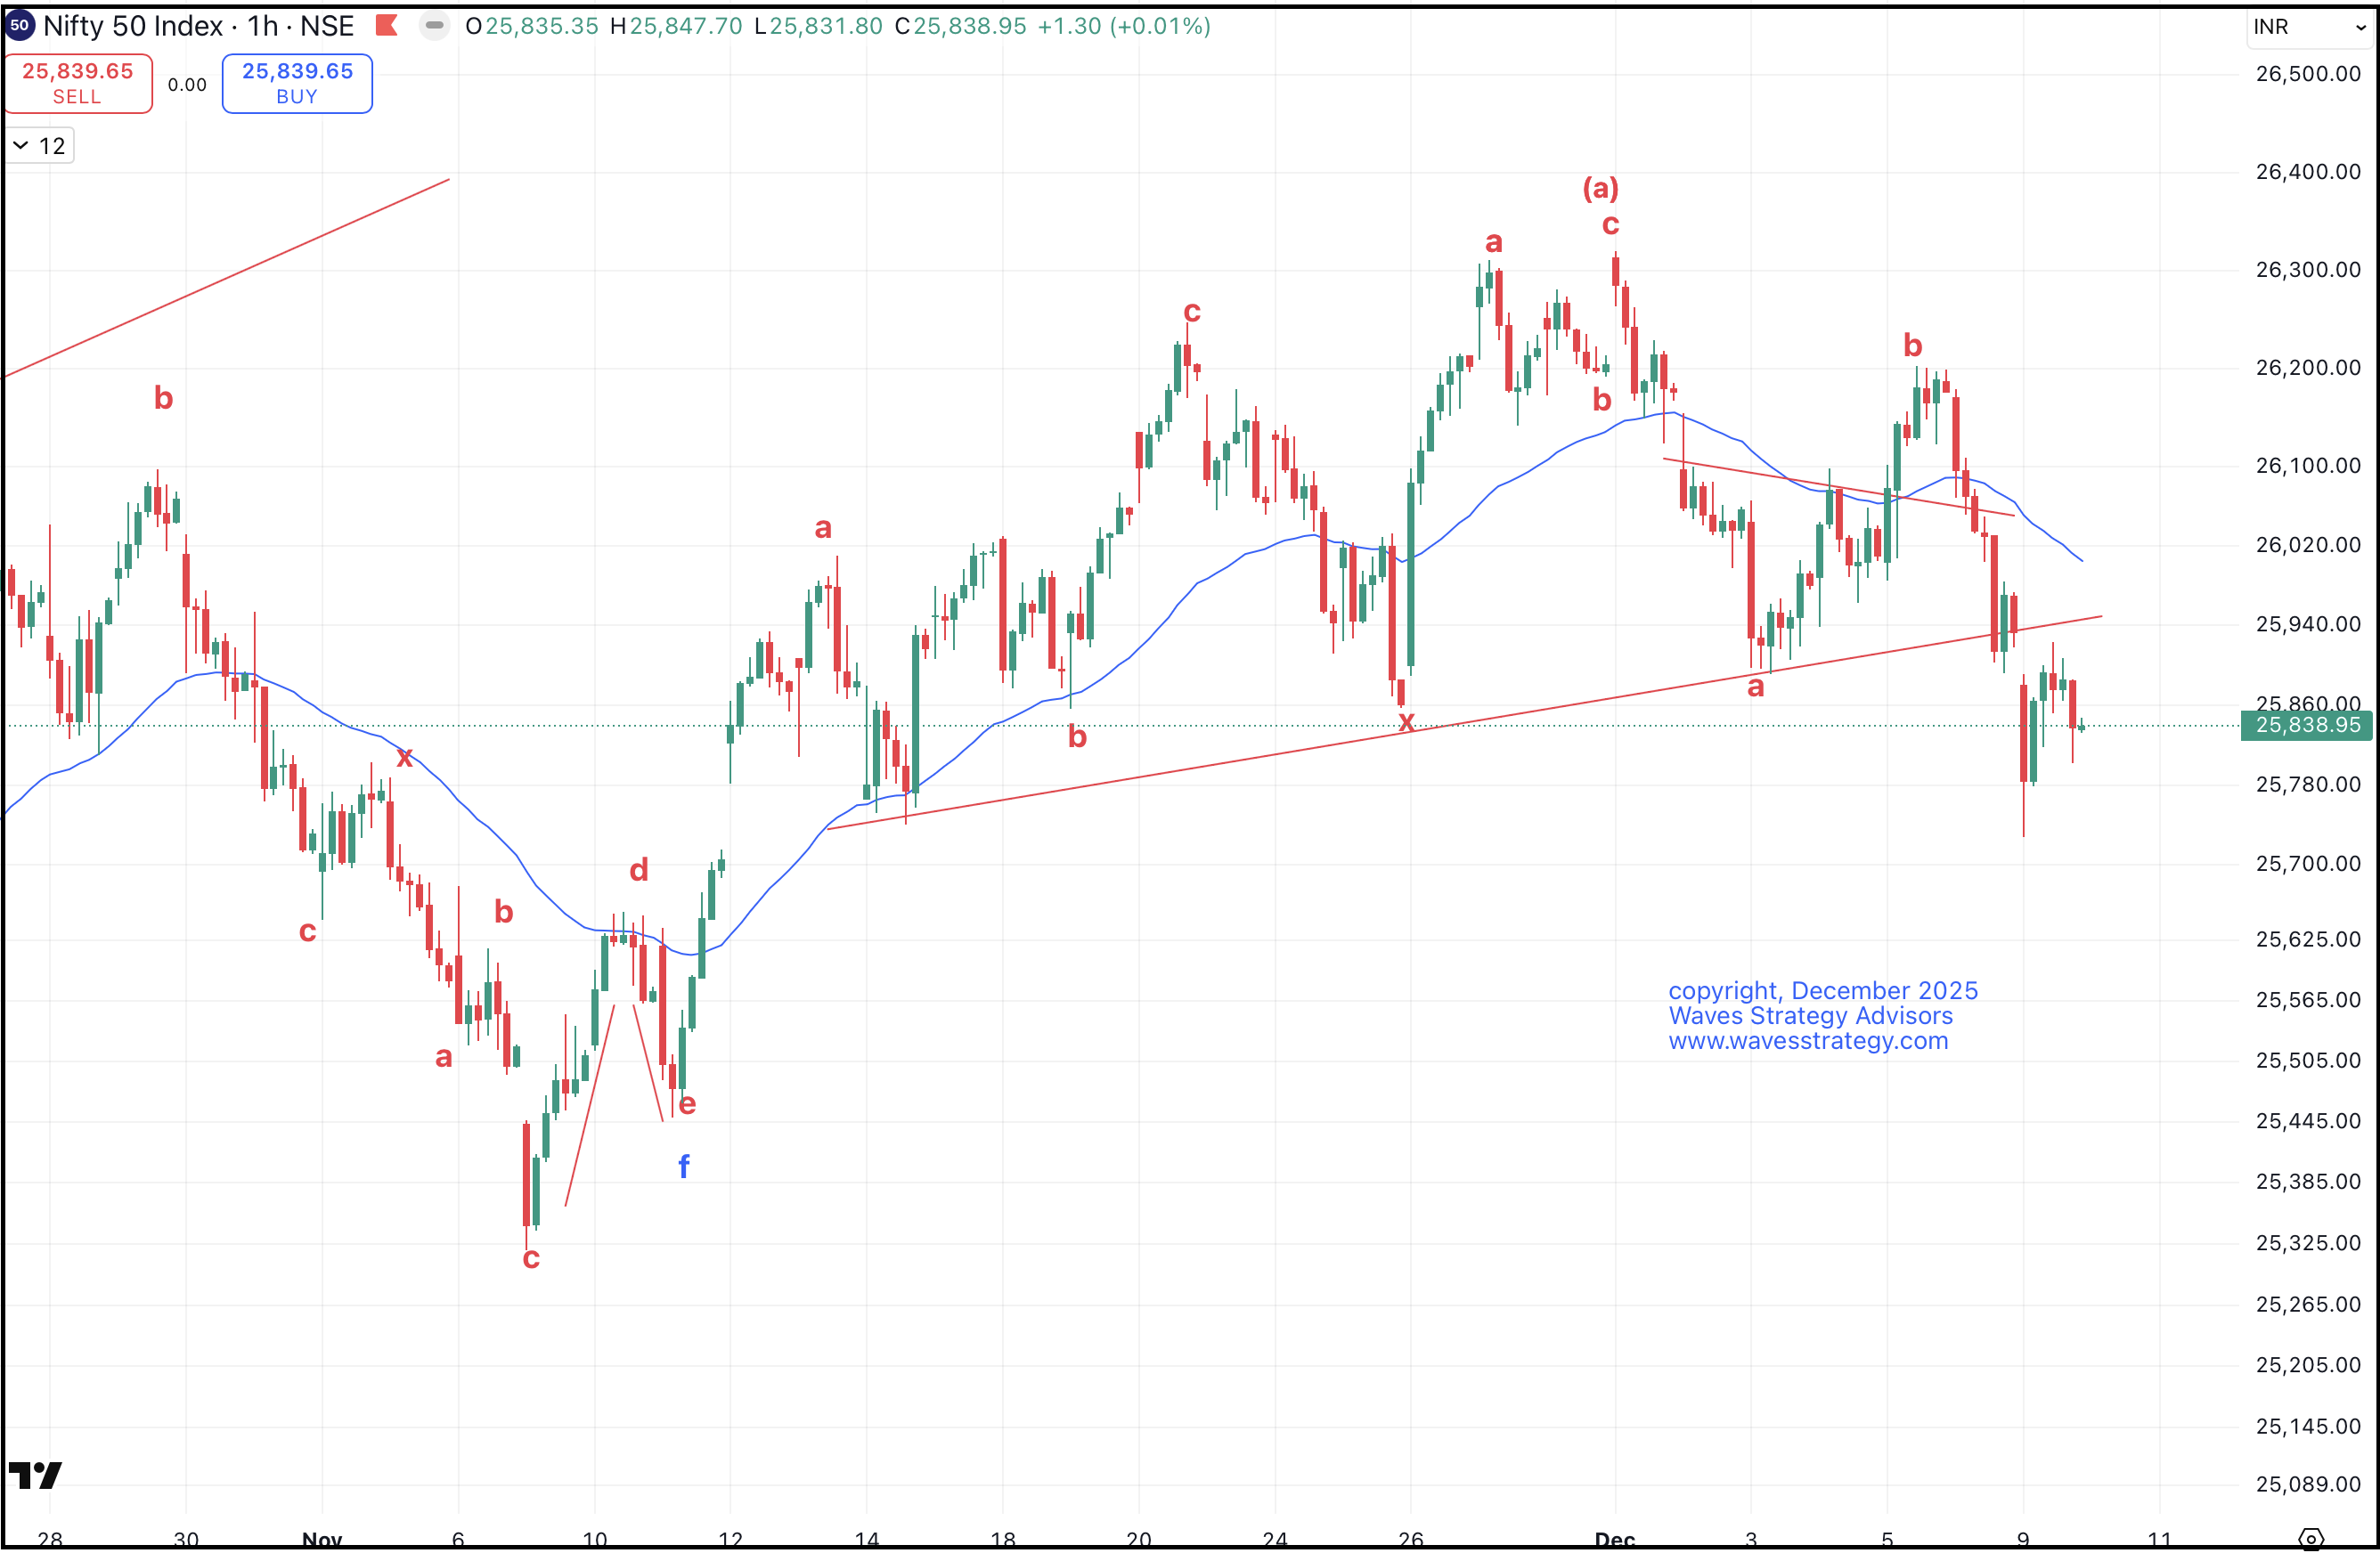
Nifty hourly chart:
Price Structure Based on NeoWave Counts
As shown on the daily chart, price action completed Wave (f) near 25,300 levels, post which the index moved sharply higher toward 26,300. After testing this level, the momentum has started showing signs of fatigue.
We have earlier hinted that Nifty is currently positioned within a time cycle sell zone, which can be observed through the lower semicircle shown on the chart. This semicircle represents the region where the time cycle typically turns downward after an upward phase.
Understanding the 55-Day Time Cycle Window
This time cycle pressure zone is expected to continue until 12th December.
However, it is extremely important to note that:
Time in markets is dynamic — not a single fixed day.
This is why the actual reversal zone can extend beyond the exact date. Historical observations indicate that there is often a 4-5 day overshoot potential. Therefore, the broader reversal window now ranges from:
- 12th December to 18th December
Within this window, we expect the market to form a meaningful bottom, after which a fresh upward rally should commence.
Current Wave Position: Inside Wave (g)
From a NeoWave standpoint, the larger structure suggests Nifty is moving in the form of Wave (g). Within this:
- Wave (a) appears complete at the recent top of 26,330
- The index is now moving lower in the form of Wave (b)
Key Fibonacci Support Levels
On the hourly chart, critical Fibonacci retracements indicate:
| Level Type | Value |
| 61.8% Retracement Support | 25,728 (formed yesterday) |
| 76.4% Retracement Support | 25,558 |
As long as price remains below the recent swing high of 26,030, the index is likely to either consolidate or come under continued pressure for the next 1–2 sessions before the uptrend resumes.
Important Confirmation Levels
- Break above 26,030 → First indication of a positive reversal
This move would likely trap late short sellers and trigger a sharp short covering rally. - Close below 25,728 → Opens the path for a deeper decline toward 25,558.
Trading Strategy Outlook
The overall pattern combining NeoWave and the 55-day time cycle suggests that:
- Price is currently consolidating and drifting lower
- Until Nifty closes above the prior day’s high, caution is advisable
My short-term approach remains:
Nifty is at crucial juncture, with possible consolidation between 25930 – 25728 levels, below 25728 decline can deepen to 25558, on upside break above 26030 is required for positivity.
Brahmastra (Mentorship on Timing the market) – Learn to time the market to the very Day, Hour and Minute by combining the concepts of Hurst’s Time cycle on Index and stocks as well, Gann square of 9, Elliott wave, Neo wave and be a part of elite trader’s community who are Time Traders. Fill the form now: