Nifty Trading Using Elliott Wave with Time cycles
Oct 28, 2025
Nifty50 has persisted with its Wall of Worry climb throughout October 2025, brushing against its previous all-time highs.
Bank Nifty, meanwhile, decisively breached them-so yeah, Indian stocks are outperforming. As per last month's research report - AKASH, Wave e was still in corrective mode: slowish gains, no matter the headlines. Index hit 26104, then moving in sideways action.
This move has been precisely as expected and shown in prior monthly research.
Nifty Daily chart preferred scenario 1 (shown on 28th August 2025)

Nifty Happened so far
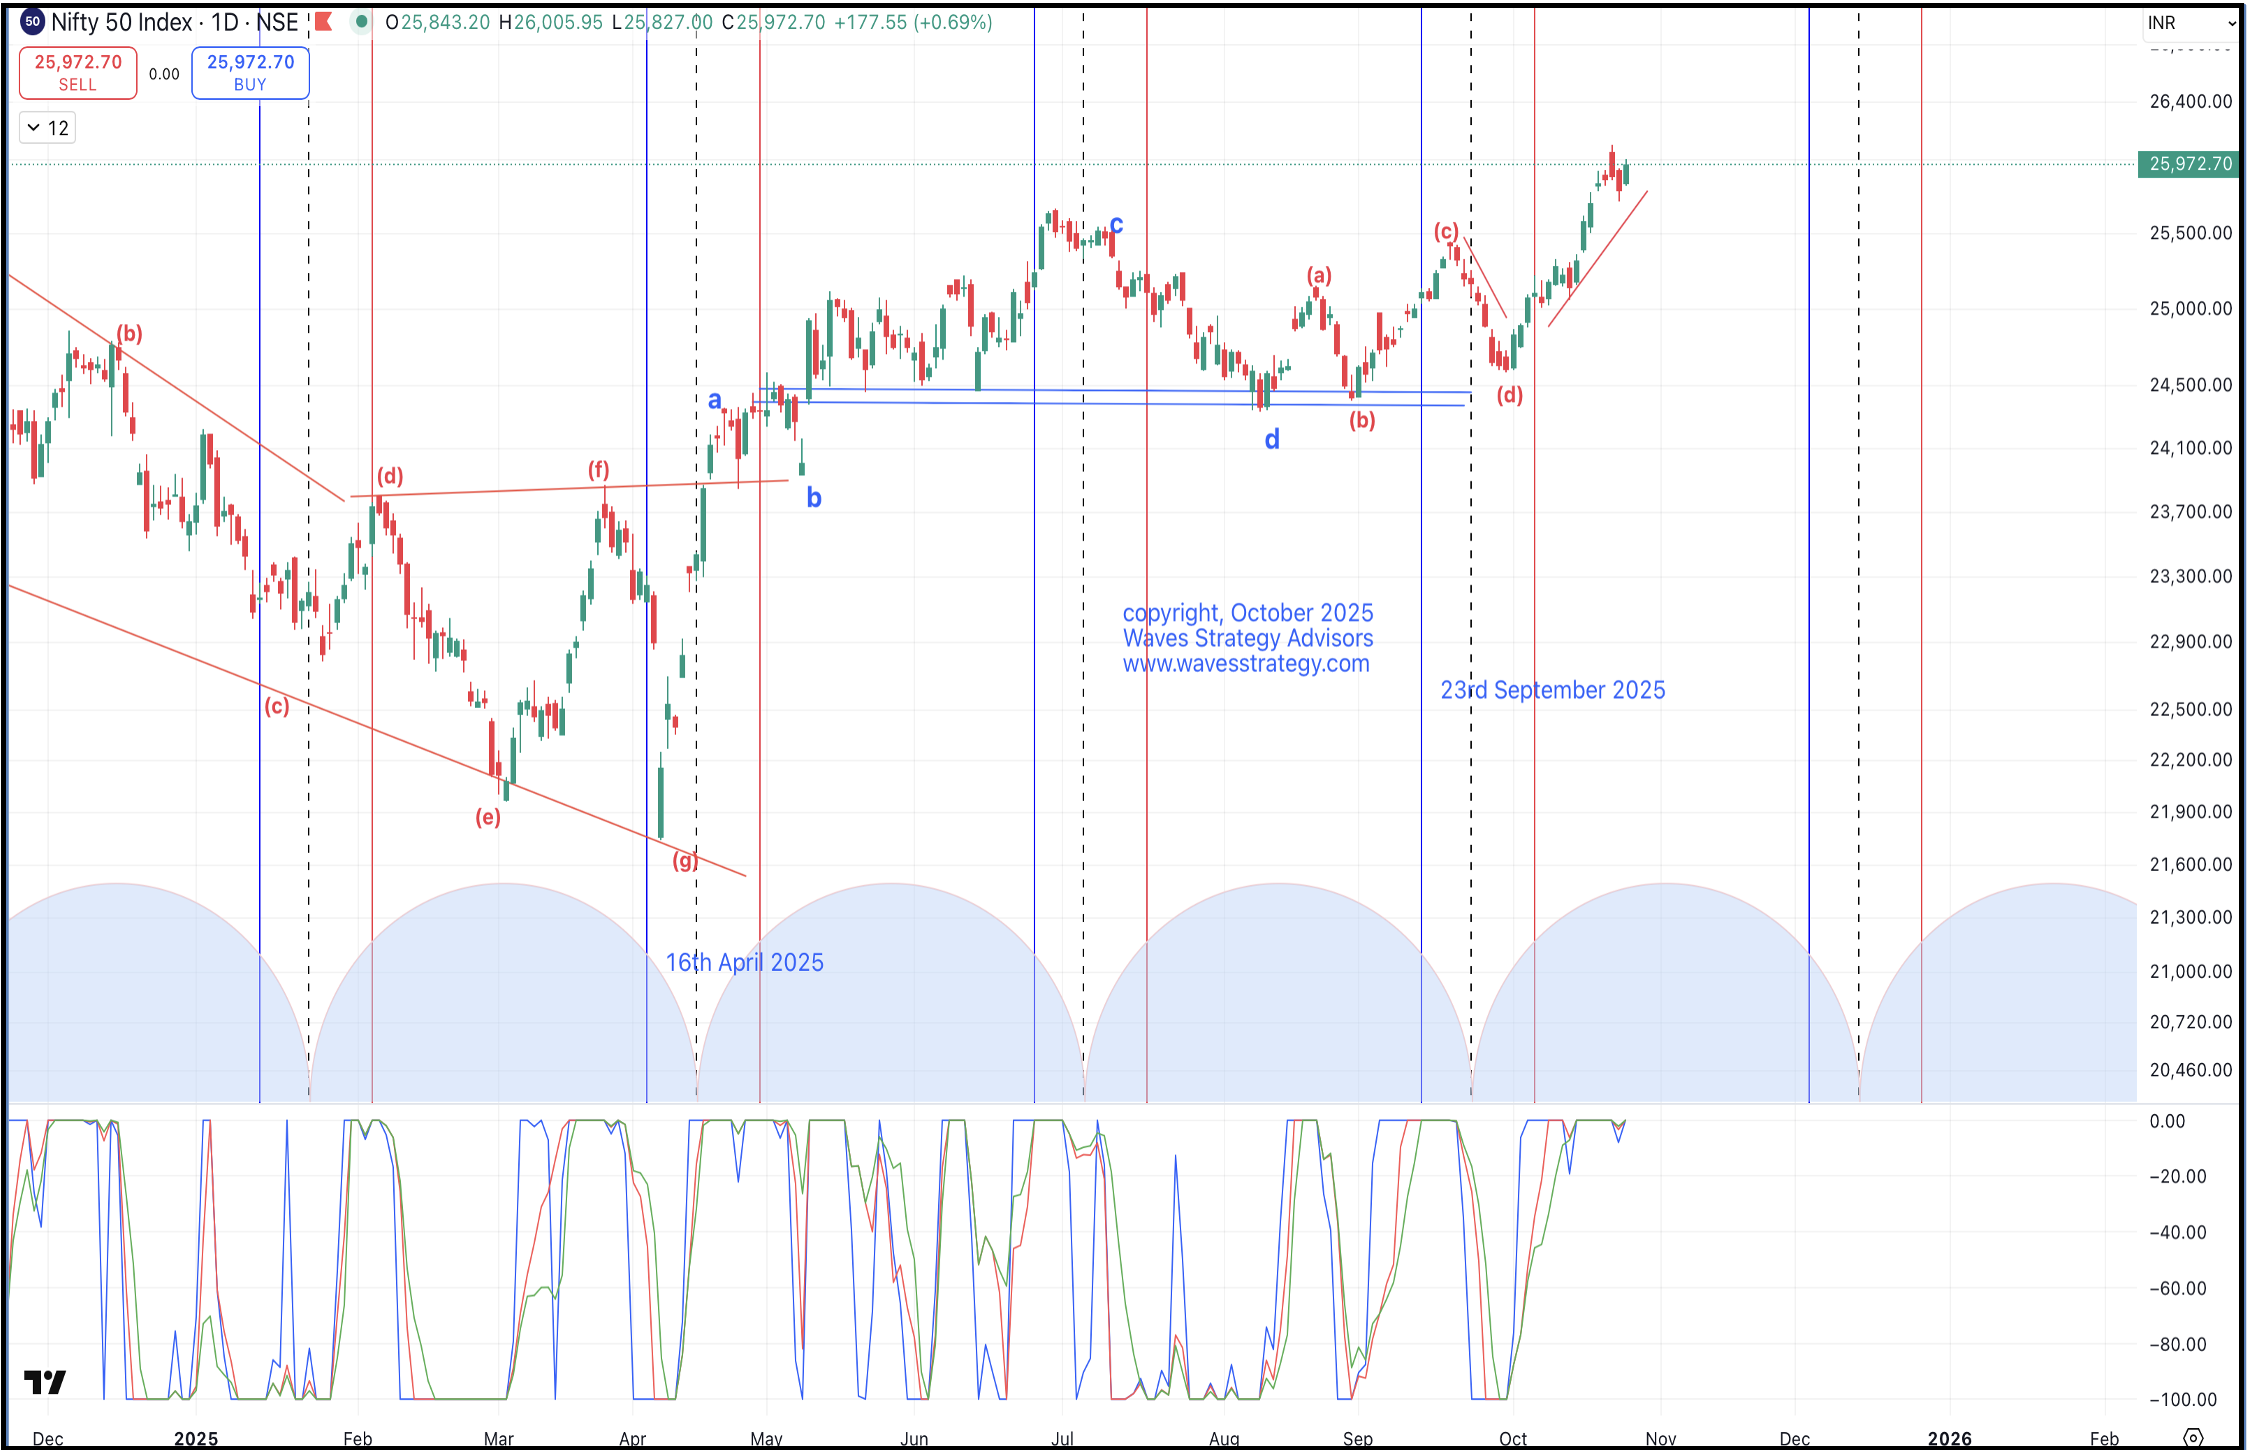
In the previous monthly update we mentioned that “Diametric is a bullish possibility with the path shown on daily chart. We have shown the path from last month report and how prices behaved so far. We can see that the rise was in sync as expectation but the fall has to halt now for that pattern to remain valid. As per the first scenario, post the short-term correction prices should inch higher towards 25500 levels in form of wave e and eventually to new highs in form of wave g.”
Nifty post breaking above the hurdle of 24900 showed sharp rise and rallied towards lifetime highs as per the preferred scenario we had mentioned in our earlier monthly research report. Also, the bottom was formed precisely from the Time cycle zone of 55 days.
For the Nifty research, our prior report accurately forecasted a breakout above key resistance levels, paving the way for new lifetime highs-a prediction that materialized exactly as anticipated. This validates the predictive strength of time cycles and NeoWave analysis.
AK Indicator on monthly, weekly and daily charts: AK indicator shown below the chart, provides momentum and trend indication. When all the 3 lines touch together on upside it is a strong indication of trend in that direction which will last until the reversal is witnessed by all 3 lines touching back on downside. We can see that this AK indicator both monthly and weekly time frames are now in sync as all lines are together higher. Monthly trend confirmation has happened for the 1st time since 2nd September 2024.
Nifty daily chart - shows price advancing inside wave e of a short-term diametric-smart move not to chase tops, but to buy any dip instead. Key floor sits at 25420; keep it, and sideways chop turns into upside breakout. Yes, profit-taking flashes could hit, yet they're just noise-the bull we've trumpeted since 21900 is roaring, and only latecomers now scramble with FOMO. Time cycles? Spot-on: the last swing low nailed our 55-day window. Expect one last sprint to 26400 lifetime highs before the routine breather.
In a nutshell, Nifty can show short term profit booking but the overall tone remains on buy side. Break above 26050 will resume up move to 26200 & higher with 25690 as immediate support. If you are an Options Trader combining it with Elliott wave – Neo wave is the perfect combination.
Brahmastra (Mentorship) on Timing the market – Learn complete science of trading with risk management, Stock selection algo creation, Elliott wave, Neo wave – Trishul and Kaal Chakra along with Mentorship sessions with exclusive access to trader’s community, Know More
Trishul Membership – Trade Options using powerful trade setups of KST, Keltner Channel and forecasting using Elliott wave – Neo wave methods, Options are powerful instrument if one can combine it with Momentum and forecasting methods, Trishul program is combination of Options Mantra scheduled on 8th – 9th November, Sutra of Waves covering Elliott Wave, Neo Wave on 6th – 7th December, Limited seats left. Fill below form for more details: