Nifty Elliott Wave & NeoWave: The GPS of Stock Market Forecasting
Dec 01, 2025
Elliott Wave or NeoWave analysis is often referred to as the GPS of the market — because it helps identify the exact path of price movement from one point to another. Over the years, it has proven to be one of the most powerful and reliable market forecasting systems, applicable across stocks, commodities, indices, and even short timeframes like a 5-minute chart.
In this research update, we apply NeoWave principles to the Nifty 5-minute chart, demonstrating how traders can use wave structure, Fibonacci levels, moving averages, and two-stage confirmation to plan high-probability trades.
Nifty 5 mins chart
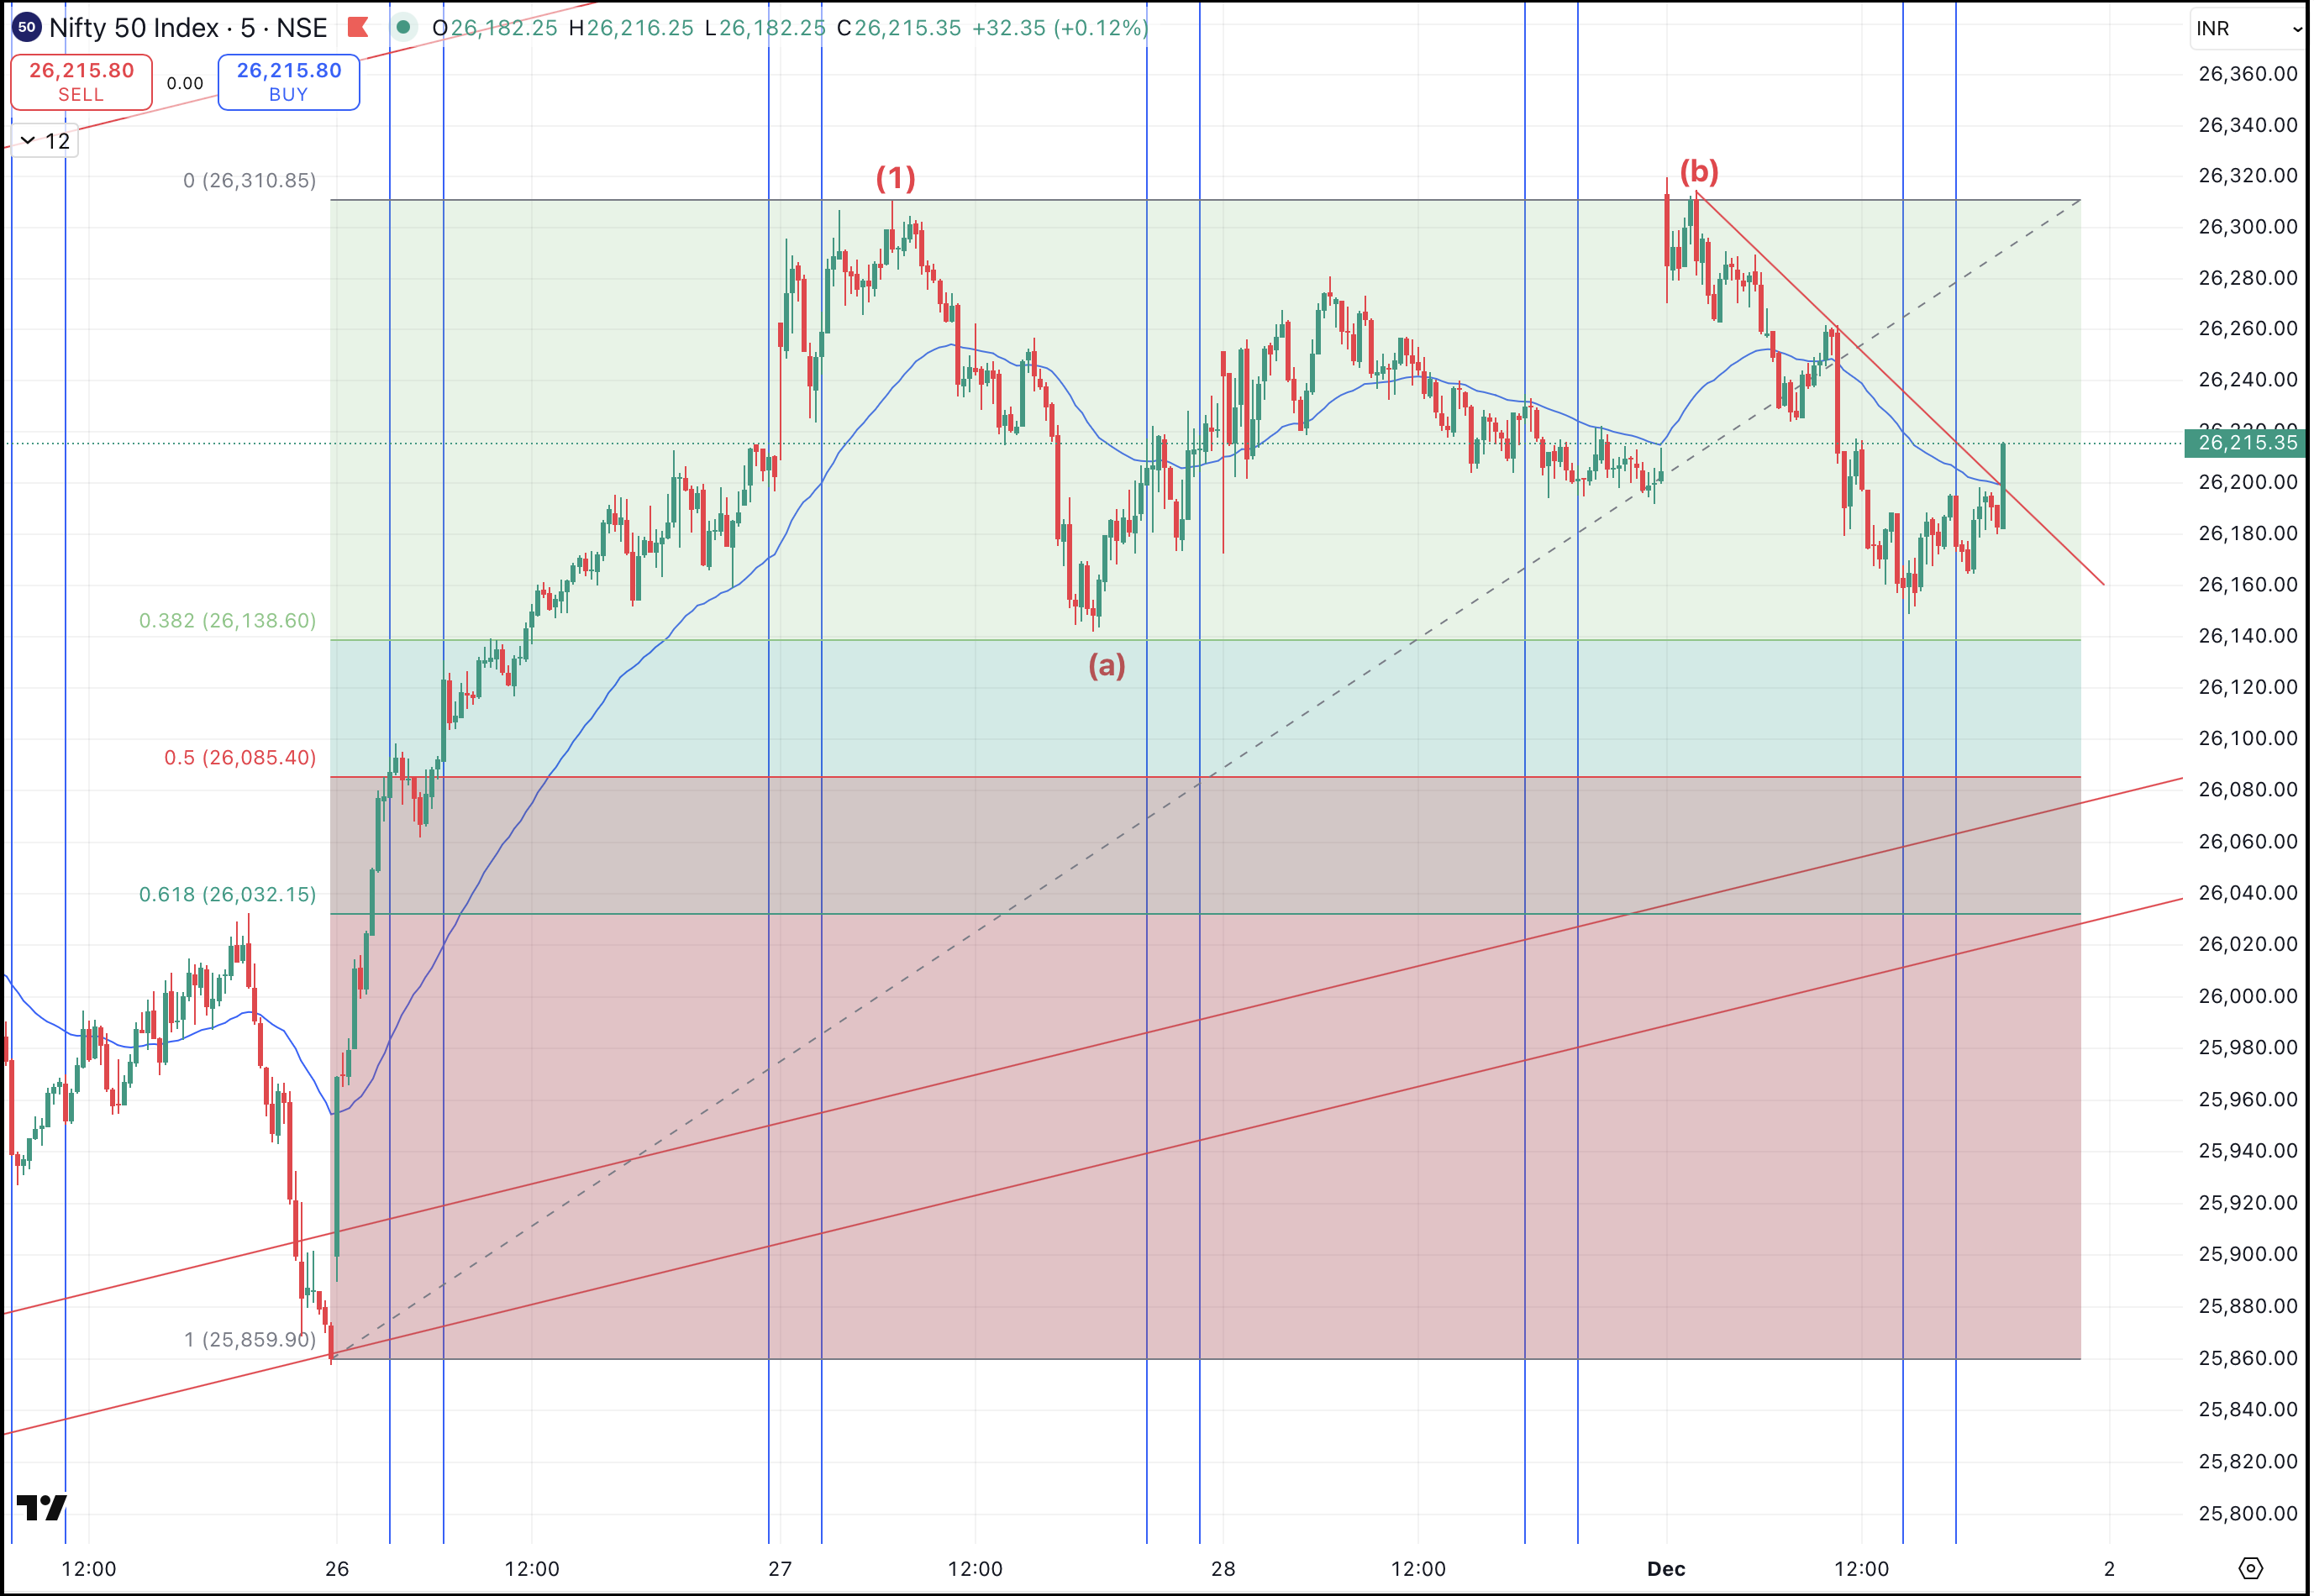
Wave Interpretation on the Nifty 5-Minute Chart
The chart above shows the recent internal structure of Nifty:
- The rise from 25,860 to 26,310 formed a clear Impulsive Wave 1.
- After Wave 1, the market entered a flat corrective structure:
- Wave a on the downside
- Wave b subdividing into three smaller waves
- Wave c currently unfolding
Once Wave c completes, the structure will signal the end of Wave 2 correction, preparing the market for a strong upside rally as Wave 3 begins.
NeoWave Confirmation Strategy: Two-Stage Faster Retracement
One of the most effective NeoWave confirmation techniques is the Two-Stage Faster Retracement Rule. As per this principle:
- Price must break above the 2–4 trendline in less time than it took Wave C to form.
- The entire Wave C decline must be retraced in faster time.
Once these conditions are met, traders receive a high probability early entry with a tight stop-loss (at the low of Wave C) — setting up an opportunity to ride the upcoming Wave 3 rally.
Key Support, Resistance, and Indicators
- Nifty has taken support near 26,138, which is the 38.2% Fibonacci retracement of the entire rally.
- If price moves below this level, a sideways consolidation may continue, potentially retesting 26,085.
- A breakout above the red trendline on the chart will be the first bullish confirmation.
- The 43-period moving average is acting as a strong dynamic support.
- The vertical time cycle markers on the chart support timing confirmation for the next trend reversal.
Expected Price Scenario
- Below 26,138 = sideways to mildly bearish move toward 26,085
- Above 26,220 – 26,260 = confirmation of Wave 3 uptrend
- Wave 3 targets: 26,400 → 26,600
In summary, combining Elliott Wave and NeoWave with confirmation techniques allows traders to create precise strategies suitable for scalping, intraday trading, positional trading, or stock selection.
🔥 Mentorship Program – Brahmastra (Timing the Markets)
Take your trading mastery to the next level with Brahmastra Mentorship, where you will learn:
- Elliott Wave & NeoWave trading
- Complete Options Trading System
- Time Cycles
- Stock Selection Algorithms
- Practical Market Execution
📌 Click here for more details and enrollment.
📌 Learn Elliott Wave, NeoWave, Fibonacci & Timing the Market
🚀 Sutra of Waves workshop is happening on 6th & 7th December
Join this powerful 2-day learning experience covering:
- Advanced Elliott Wave
- NeoWave
- Ichimoku Cloud
- Fibonacci Techniques
- Two-Stage Confirmation System
⏳ Limited Seats Only — Register Now
👉 Fill the form below to secure your seat.