Nifty Neo Wave Diametric Pattern with Bollinger Bands®!
Jul 12, 2021
Nifty is stuck in a range for more than a month and many traders are wondering if it is time to buy or sell!
For us, it has been a clear Option writing strategy even before this sideways churning happened and Elliott wave with Time cycles worked out brilliantly for helping us take that stand much early on.
Below chart is picked up from the morning daily research report – The Financial Waves Short term update
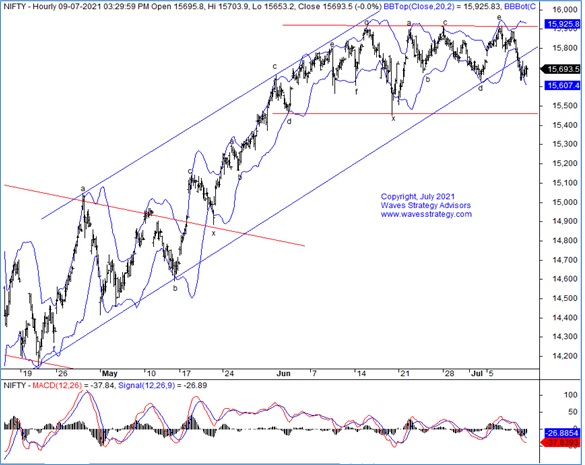
Nifty 60 mins chart:
Wave analysis:
Following is a part picked from morning Equity research report -
Let us also look at the Global Equities trend to understand the overall sentiments prevailing among the investors and traders. Irrespective of anything, Dow Jones Industrial Average continued positive trend and trading near to the highs. Same goes with Nasdaq100 and S&P500 where there are no loss of upside momentum. European Equities DAX, FTSE and CAC40 recovered sharply on upside in Friday’s session and overall trend still remains on bullish side. As against to this, Asian equities have been intact into lower highs lower lows structure on the daily chart and hence one should understand that movement of Asian equities is going to be crucial for Indian Equity market.
Now coming back to Nifty, on daily chart (shown in morning research) we can see that prices are testing the crucial channel support which is intact for more than 1 year. Apart from that it is close to the swing area support of 1……. levels. Along with the same, it has also arrived at the lower Bollinger bands and formed Doji candlestick pattern in last session. All these together indicates that any close below ……. level with increase in momentum will suggests…….
On 60 mins chart, we have modified the counts to some extent to accommodate the recent price structure. As per this, prices are forming Diametric pattern in third standard correction wherein minute wave f is ongoing. As per this pattern, one more leg on upside is pending in form of minute wave g which will complete the pattern. ….In short, Nifty is trading at extremely crucial juncture and one should remain alert now. Any close below ….. will suggest that trend towards ……….. is in place. At the same time, any move back above ……. zone will hint towards consolidation
The above clearly shows that by combining simple methods like CandleStick, Bollinger Bands along with Elliott Wave – Neo Wave theory one can take Intraday / Positional Trades and accordingly form amazing trading strategy with high accuracy.
Subscribe to “The Financial Waves Short Term Update” equity research which covers Nifty, Bank Nifty, Stocks detailed Elliott wave outlook. Get access here
3 Months of Mentorship on Technical Analysis – starts on 17th July and we are ensuring to give away everything we have got in this Mentorship with complete Trade plan, Strategy, Tools to use for Algo creation, Stock Selection, Portfolio creation. If we can do it even you can it is just the question of willingness and taking that step to move away from mediocrity towards freedom. Time is NOW to become a wonderful Trader. Contact / Whatsapp on +919920422202 or Simply fill the form.