Can Nifty continue to scale higher from here on? Look what Neo wave Analysis suggests.
Jul 08, 2021
This is a short term update of Neo wave analysis of Nifty which we publish everyday to our Financial waves daily report subscribers. Checkout today’s Nifty report here.
The following update was published today premarket open to our Financial waves daily report subscribers.
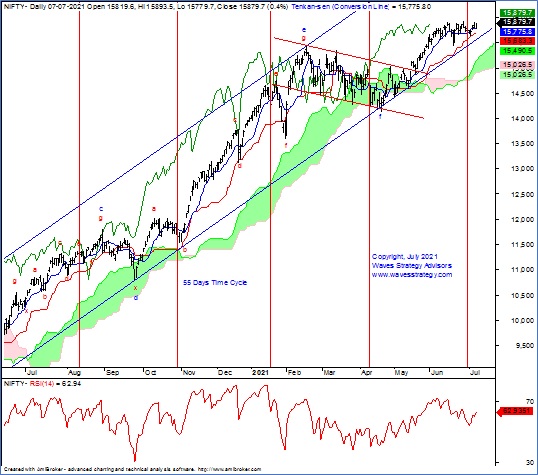
Nifty Daily chart(as of 07-07-2021):
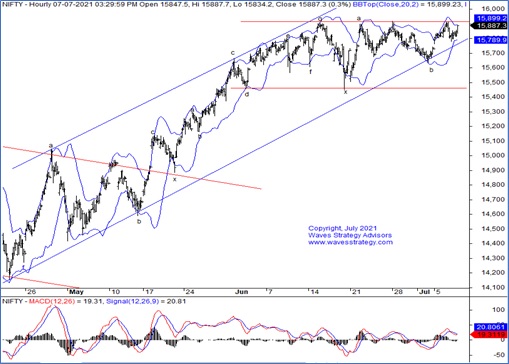
Nifty 60 mins chart:
Wave analysis:
In the last trading session Nifty had a flat opening post which it moved lower towards 15779 level in the first few minutes however after that it recovered sharply and touched the highs of 15893.55 levels. In the session of 6th July we witnessed sharp fall from the highs and now sharp recovery from lower levels. This suggest that strong battle has continued between bulls and bears and now let us see where the breakout is taking place.
Sector wise, Midcap50 and Smallcap50 regained the upside momentum and closed in the green territory. At the same time, Bank Nifty maintained its momentum and gained about 0.54%. Auto sector continued to move in a range and closed on the flat note. Metals sector did come back and rose by 2.20%. Stocks like Tata Steel, JSW Steel and Hindalco were the top three gaining stocks in the range of 2.11% to 4.95%. India VIX continued its sideways trend and closed near 12.21 levels.
On the Derivatives side, today there is weekly expiry so let us try to see where the highest OI stands. On the Call side, highest OI is placed at 16000 strike of 90353 contracts followed by 15900 strike of 59800 contracts. On the Put side, highest OI is placed at 15800 strike of 83012 contracts followed by 15700 strike of 72472 contracts. This indicates that 15800 is likely to act as support whereas 15900 looks immediate resistance on upside.
The daily chart shows that post making high near 15900 level in the mid of June 2021 prices have corrected time wise and now looks to be ready for the resumption of up move. Any daily close above 15900 level will indicate that upside has started. In the last session it has formed bullish candlestick pattern protecting the lows of prior bar on closing basis which will keep bias on upside. It has been managing to sustain above middle Bollinger bands from last 3 sessions which is a bullish sign. The difference between MACD and Signal line has started to decrease now which hints that positive momentum might build up from hereon.
On 60 mins chart, this will be the 5th time where prices will test the resistance zone of 15900-15910 levels. It is well trading within the Bollinger bands and close above upper bands is required to resume up move. From here on 15780 followed by 15630 will act as crucial support on downside.
In short, Nifty continued to witness buying from lower levels and has maintained higher high higher low structure on short term charts. Any close above 15900-15910 will indicate that next leg on upside has started.
Daily Nifty trading research report gives the trading strategy for the day and equity research report gives outlook on stocks as well. Get access to “The Financial Waves short term update” Also know the medium term outlook on market by getting access to “The Financial Monthly update” Now is the time to act. Subscribe here
Mentorship: I will be covering various such indicators and strategies which can be applied across all asset classes. It can be attended by any type of trader right from Beginner to Expert trader as the methods will be different then you might already know with complete objectivity and deriving important dates, Register Now here or Contact / WhatsApp on +919920422202