PAYTM 57 Days’ Time Cycle – Buy or Sell?
May 12, 2025
Is it possible to Time the market? Can we use methods that can predict when will prices reverse with exact date and time even on stocks?
Time Cycle is an advanced Technical Analysis study and it is surprising that such concepts can help to time the market and catch early reversals which improves decision making of the traders.
PAYTM Daily chart with 57 Days’ Time Cycle.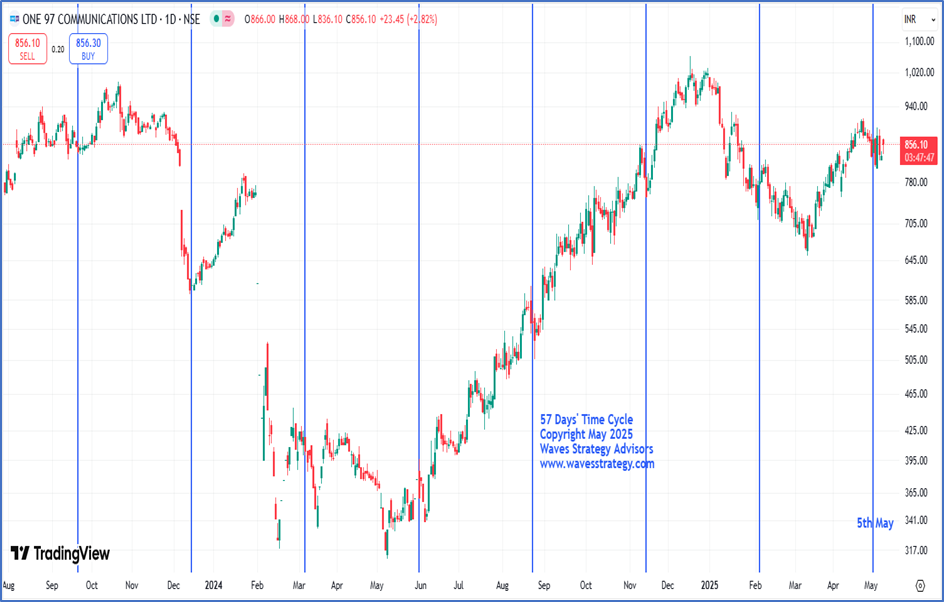 J.M. Hurst is known as the father of Time Cycles. He identified that there are a set of standard cycles that work across markets. We need to identify the time cycle working on particular stock or index.
We can see how 57-Days’ Time cycle has worked wonderfully on the stock. Every time near the cycle zone we have seen a bounce on the upside. Currently, prices have already entered into its cycle zone which was due on 5th May and formed a short-term low of 808 levels. Since then, prices have shown a rise of nearly 10% already which is a strong bullish sign. For now, the stock needs to give a decisive break above 890 followed by 913 levels for cycle to turn on buy side.
In a nutshell, above research shows power of Time trading and one need to not worry about not missing out the trend as when time is in favour, then we can catch moves well in advance if price action confirms.
Stock is at important juncture. A break above 890 followed by 913 levels is must for the Time cycle to turn on the buy side. On the downside, 808 should remain protected.
Brahmastra (Mentorship) on Timing the market - Equip yourself with tools of Elliott wave, Neo wave, Time cycle, stock selection algo creation, multibagger and momentum stocks identification along with exact trade setup that actually works. Only a few seats left! Fill below form for more details