This Simple Combo Nailed PGEL’s Breakout – Are You Using It Yet?
Jul 16, 2025
Trading KST momentum indicator with Keltner Channel are two powerful indicators.
Using momentum indicators along with breakout techniques helps traders to catch the momentum early so that they can fetch maximum gains in minimum time after the signal.
PG Electroplast Ltd (PGEL) 15 minutes chart
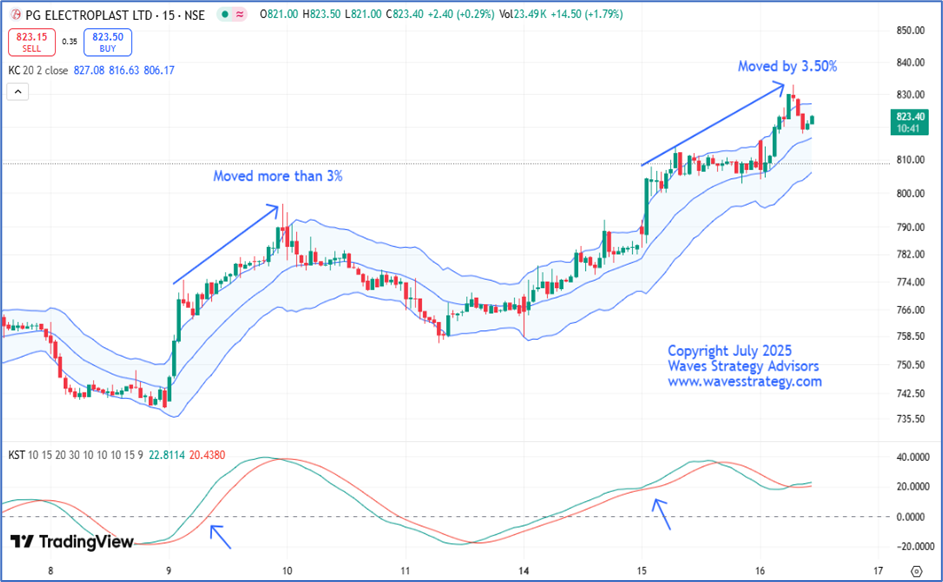
In the above chart of PGEL, we can see two important indicators that are focused on prices and momentum. This strategy usually works on Intraday and even on stocks and Indices.
Keltner channel – This indicator is different than that of Bollinger Bands®. Bollinger Bands uses standard deviation to the mean whereas Keltner channel is derived using Average True Range (ATR). Both of the indicators have different ways of application.
In Keltner channel, we can see on 9th July 2025 that prices broke above 765 levels which was above the upper boundary of the Keltner channel and we saw a movement of more than 3% in a single day. Also, on 15th July 2025, we witnessed the same breakout and saw a movement of nearly 3.50% on the upside.
KST momentum – Breakout on Keltner channel was also accompanied by KST momentum indicator. KST momentum indicator turned above signal line and also broke above 0 line thereby giving strong confirmation that momentum was picking up on the upside.
In a nutshell, Keltner channel helps to understand if the size of candle is increasing which is suggesting a significant move and KST further provides confirmation of momentum. Price action above 827-830 levels which is upper end of the Keltner channel will result into another synchronous signal from these indicators.
Brahmastra (Mentorship) on Timing the market – Equip yourself with tools of Elliott wave, Neo wave, Time cycle, stock selection algo creation, Multibagger and momentum stocks identification along with exact trade setup that actually works. Fill below form for more details.