ABB Up 10%, Rounding Bottom & Bollinger Bands®
Jun 02, 2021
Midcap and Smallcap stocks are in buzz as Nifty continued to move in uncharted territory at lifetime high levels.
During such scenario Stocks like ABB moved very well if one were to use simple patterns and Bollinger Bands. Read below to see what made us bullish on this stock just before the breakout happened:
ABB 60 minutes chart: Anticipated
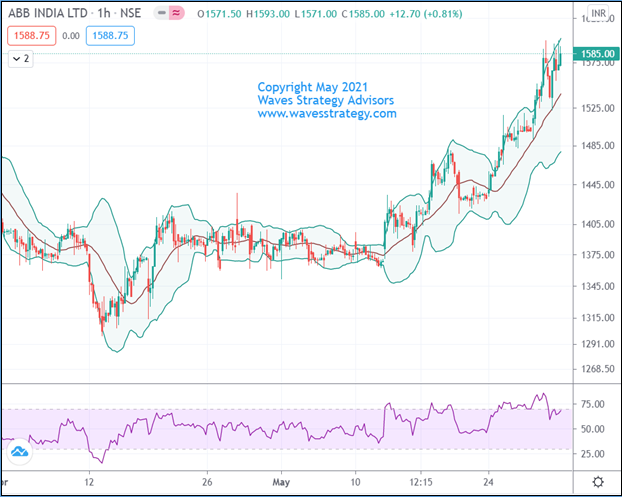
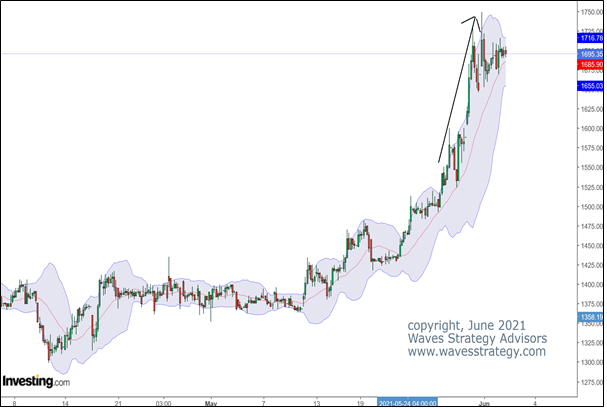
ABB 60 minutes chart: Happened
Wave analysis: Following was published on 31st May 2021 in morning daily research report – The Financial Waves Short Term update
Anticipated - On the daily chart (shown in actual research), we can see that prices have formed ‘Rounding bottom pattern’. The said patterns significance is more when it forms after a downtrend. Here prices are already in uptrend, nevertheless this definitely indicates towards continuation of bullish trend. A close above 1635 level will confirm breakout from this pattern and then uptrend can continue towards …. which is the target of the said pattern. On the hourly chart, we have shown the Bollinger Bands wherein we can see that stock is taking support of the middle bands and has continued to rally. The momentum on upside remains strong and hence any dips towards ……. area should be used as an entry point for creating long positions. In short, trend for ABB remains positive. Buy near ………. zone with 1485 as support and then move towards …….. can be expected.
Happened: ABB moved precisely as expected and the stock rallied by 10% on the same day. This clearly shows that by identifying certain patterns and using simple tools like Bollinger Bands one can still ride the trend in Cash stocks.
Want to get such charts with clear strategy and explanation. Get access to “The Financial Waves Short Term Update” that contains view on Nifty, Bank Nifty, Stocks that can provide good trading opportunity. Subscribe annually and get monthly research free along with it. Time is now to be profitable – Subscribe here
Time the Market to the very Day, Hour and Minute – Master of Cycles event on 12th – 13th June 2021 is going to give Simple, easily applicable tools and strategy for Intraday Traders, Positional Traders, Investors across Stocks, Commodity, Currency. This event happens only once in a year and you cannot miss out on learning the science of timing the markets. Register here NOW
3 Months of Mentorship on Technical Analysis – It is best to learn the techniques of market timing and trading in disciplined fashion with stock selection algos from Ashish Kyal, Author of International Book and see how by following simple methods and disciplined approach you can trade with high accuracy and consistency. Know more