How to catch a BIG move using a simple chart pattern with Indicator
Apr 20, 2022
Like this Article? Share it with your friends!
Trading breakouts can be tricky sometimes and it's best to use additional confirmation of other indicators to identify strong breakouts. Check out how we recently identified one such breakout in ADANI GREEN
Stocks like Adani Green moved very well if one were to use simple patterns and Ichimoku Cloud.
We published the following article on Adani Green pre-market on 6th April 2022 in "The Financial Waves Short Term Update" which our subscribers receive pre-market every day.
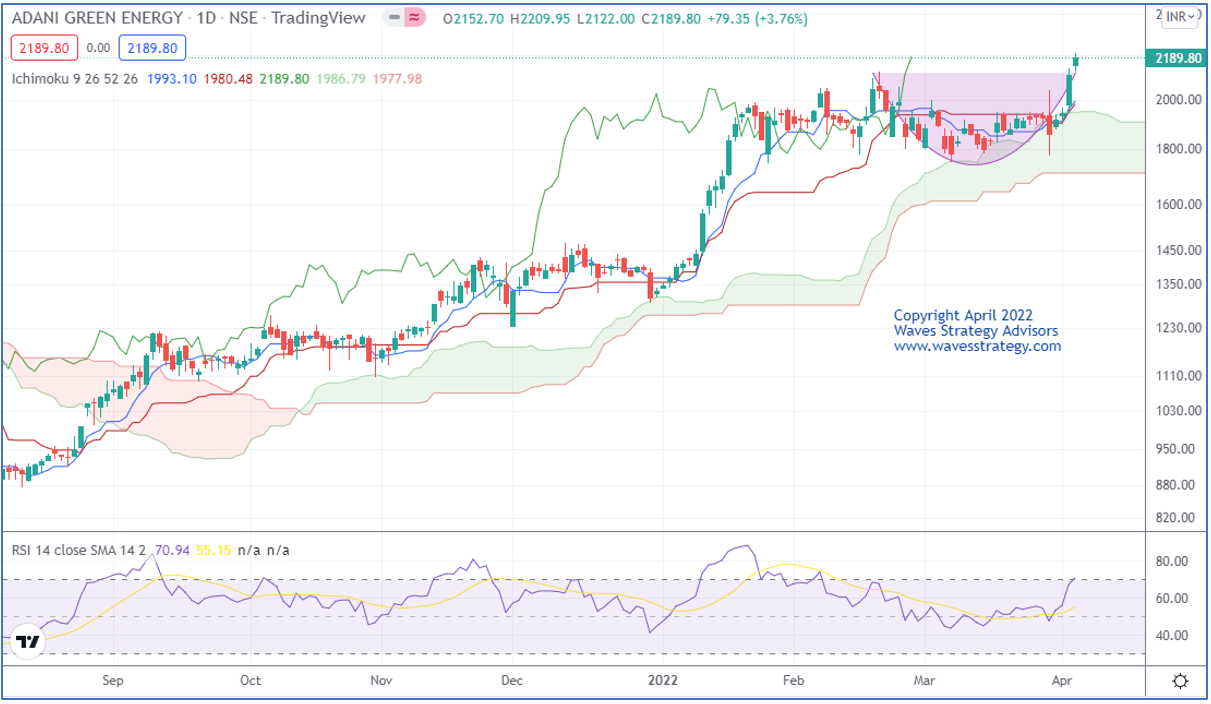
ADANIGREEN AS ON 6th April 2022 (Anticipated)
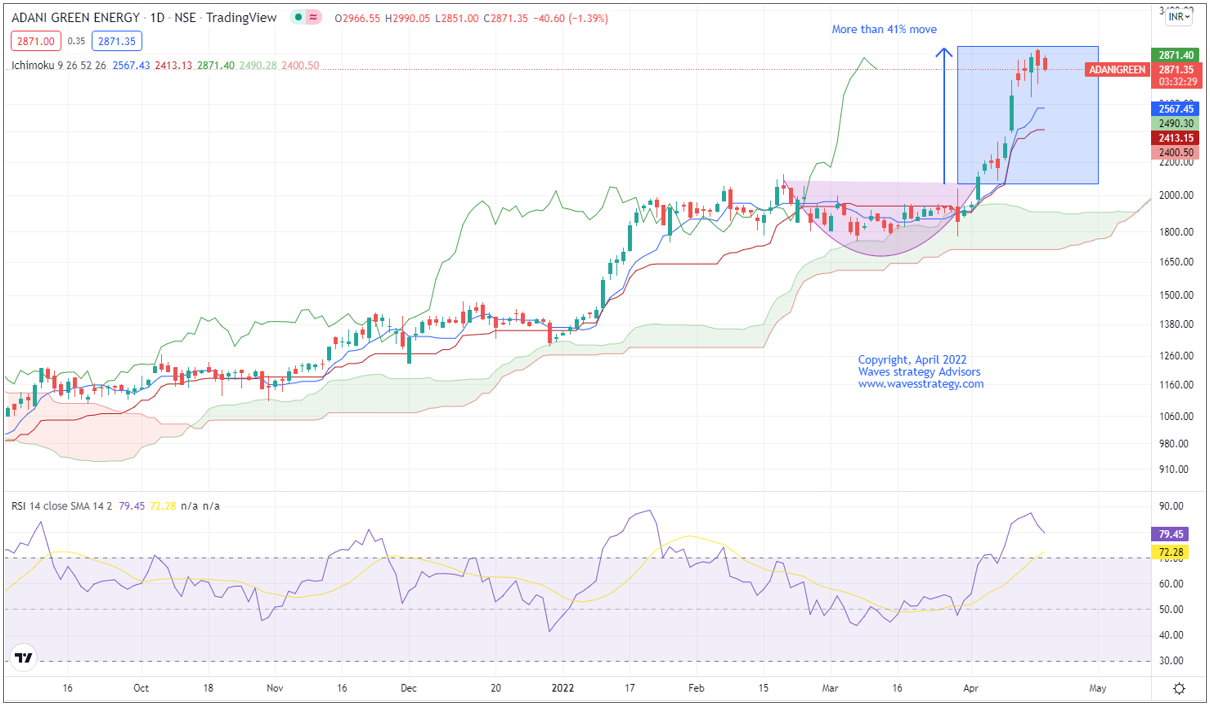
ADANIGREEN as on 20th April 2022 (Happend)
Wave analysis as on 20th April 2022
On the daily chart, in the previous session prices formed a bullish candle. Price has closed above 2125 levels which confirm breakout of rounding bottom pattern. Price has recently bounced from the Ichimoku cloud which can act as near-term support zone.
In short, trend for this stock is positive. Use dips towards 2160-2140 as buying opportunity for a move towards 2380-2400 levels as long as 2050 holds on the downside.
Happened: Stock has opened gap up and moved as expected towards higher levels. The formation of Rounding bottom along with support from the ichimoku cloud had provided the confirmation of the breakout. As we can see within the few trading sessions, price had made the high of 3050 that is nearly 41% up from its breakout.
Learn the science of trading options and forming strategy in upcoming Options Trading using Technical Analysis (OTTA) on 23rd-24th April using Pay off charts, clearly defined trade setups, Indicators, Moving averages and much more directly applied on Options chart for Option buy and sell strategy. 3 days to go for OTTA. Do not miss this opportunity. Fill out the form below for more details: