What is Elliott wave, AD line, PCR ratio and Channels suggesting for Nifty Trend
Jul 23, 2020Nifty is near a resistance zone and the breadth is waning out with strong bullish sentiments and extreme PCR readings. These are times to be alert and not complacent.
It is during such extreme scenarios we need to be most objective to understand the key reversal areas along with the risk associated for being with the crowd.
Nevertheless, there are methods that help us to understand maturity of trend. Also a trade requires prudent risk reward ratio. Prices can continue to rise but one should analyze is it worth the risk!
Now look at below few simple channeling techniques and analyze yourself if the methods are making sense:
Nifty hourly chart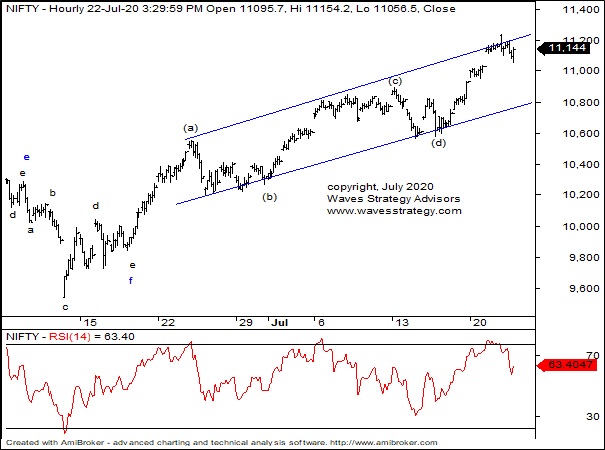
Nifty PE ratio
Following is part of the research from Daily research report
Wave Analysis:
Nifty Put Call ratio (PCR) has now climbed to 1.65 which is extremely elevated levels that has not been seen for quite some time. On many occasions we have seen markets entering into a topping zone when Nifty PCR hits this high. The extreme readings have been 1.50 and above. Keeping a watch on this ratio can give some leading indication to the maturity of the current trend. Many of the retail participants who have been only tracking the broader index and a few heavy weights like Reliance, Infosys, HDFC twins is assuming that the entire market is in an uptrend but that is not the case as of now.
As can be seen from NSE Advance decline ratio prices have been inching higher but the overall Advance Decline line is moving lower in this final phase of up move. This is another indication of the broader market are not participating in this up move and many might get trapped in case the index reverses suddenly. We are not bearish but these are the indicators which forces us to maintain a cautious stand on the markets given the fact that prices are hitting the “WALL” that we have been discussing in our weekly webinars on Friday @ 4.
On the hourly chart wave g is unfolding as a diametric pattern. Within wave g currently wave (e) is ongoing. We can wee that price whipsawed across the channel resistance and moved back inside the channel. It is normally observed that the 3rd pattern within complex correction forms a triangle and so there is possibility of a range bound movement between 11250-10950 levels over the next few days.
To get insight into important support levels and Elliott wave perspective on Nifty and stocks you can opt for the research report The Financial Waves short term update. For copy of your research Register Here
Learn the power of Elliott wave with simple technique and equip yourself with tools of technical analysis in the upcoming Online module of Master of Technical analysis (MOTA) and Master of Elliott Waves, Neo wave with Time cycles (MOW). I will ensure you stop following the news and start trading the charts because this is what is required to be successful. MOTA training starts 1 day to go. Are you in the game! Know more here