AAPARINDS: combining time cycles with rounding bottom pattern
Jun 27, 2022
Like this Article? Share it with your friends!
It is possible to capture massive moves in stocks using Time cycles and simple price patterns.
We used these 2 indicators on APARINDS and were able to capture a 17% move in a short span. You can also use these to identify stocks with momentum for short-term trades.
We published APARINDS analysis in "The Financial Waves Short Term Update" on 20th June 2022 which our subscribers receive pre-market every day. Check out below the detailed research report that we published.
APARINDS as on 20nd June 2022 (Anticipated) 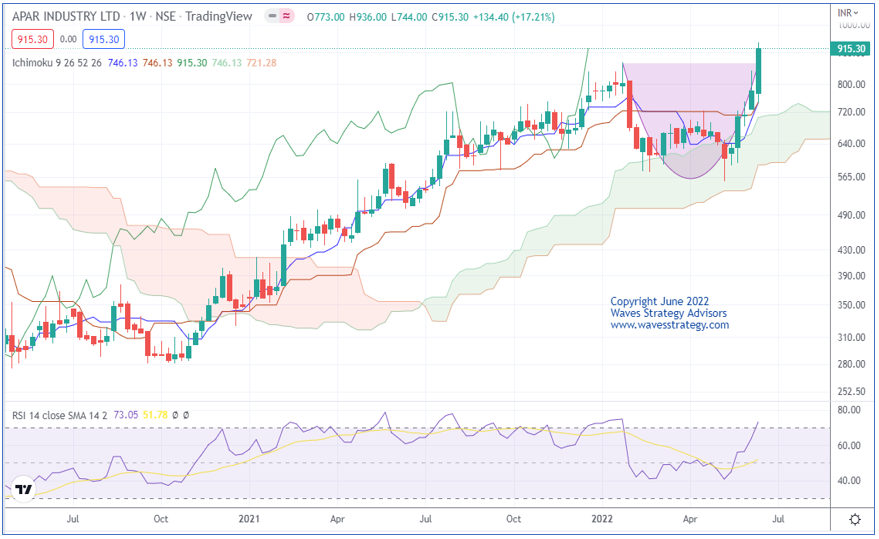 APARINDS as on 27th June 2022 (Happened)
Wave analysis as we published on 20nd June 2022
On the weekly chart, in the previous session prices formed a bullish candle. Price has closed above 868 levels which confirm breakout of rounding bottom pattern. Price has recently bounced from the ichimoku cloud which can act as near-term support zone.
In short, trend for this stock is positive. Use dips towards 890-900 as buying opportunity for a move towards 1000-1010 levels as long as 870 holds on the downside.
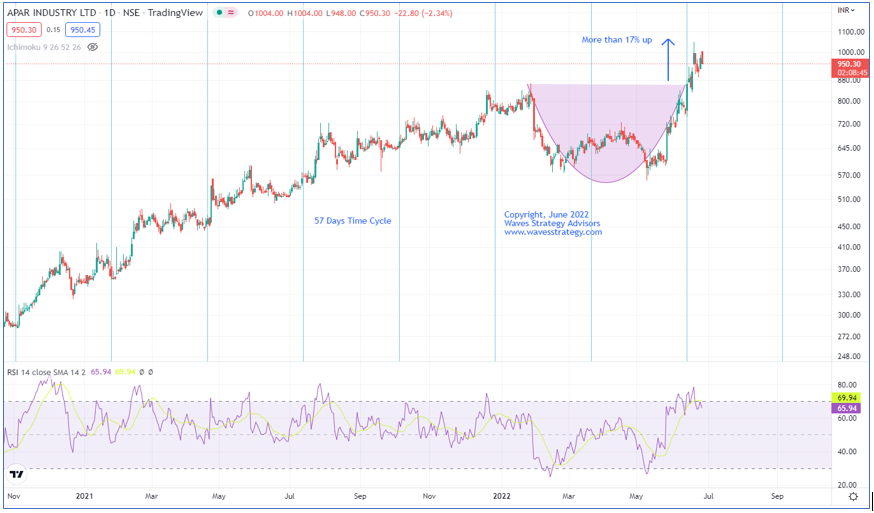
Happened
APARINDS is following 57 Days Time cycle extremely well. The recent sharp rise also came from the cycle day along with rounding bottom pattern formation. So the price and Time were in sync together.
The stock moved as we expected. APARINDS have given breakout of rounding bottom with huge volume which was a bullish sign. Within short span of time, the stock has achieved our target and made high of 1049 levels giving 17% move.
Time is the essence for trading giving the necessary edge. Majority of Traders are only focusing on prices and not time but if both Price and Time are in sync breakouts will work with much high accuracy.