Application of Bollinger Bands, Parabolic SAR on Silver.
Feb 08, 2021
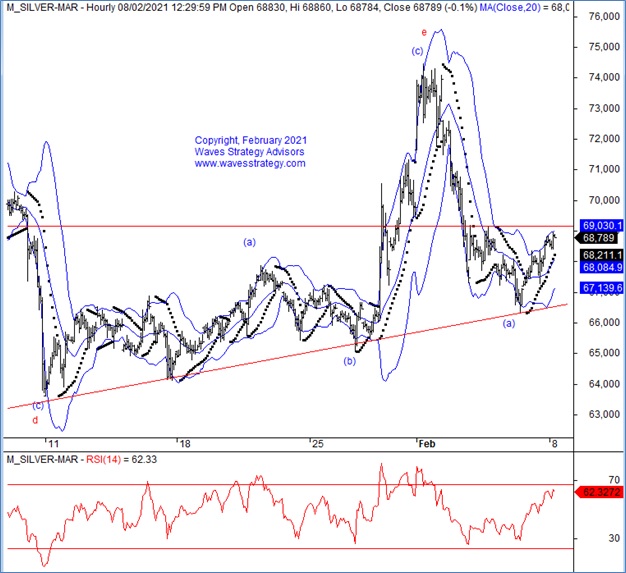
MCX Silver seems to be exhibiting amazing Elliott wave patterns and with the help of indicators like Bollinger Band and Parabolic SAR we can capture the move effectively.
MCX Silver hourly chart
Elliott wave Analysis-
As per the wave count, wave (b) within wave f(red) seems to have started on the upside but a break above 69150 will confirm the same. Price can move towards 69900 in the form of wave (b).
Bollinger Band & Parabolic SAR –Bollinger band which suggests that prices were taking support at the lower band and then moved towards the upper band. Prices closed near upper bollinger band which is a sign of bullishness for the coming session as long as lower bollinger is intact on downside. The Parabolic SAR is used to determine the price direction as well as draw attention to when the price direction is changing. A series of dots placed below the price which is deemed to be a bullish signal. The Parabolic SAR has now confirmed that bullish momentum is just about to ignite and the PSAR has already moved below price and it could not be a better opportunity to go long using the PSAR as a trailing stoploss.
In short, Silver seems to be sideways to positive. A break above 69150 can take price towards 69900 levels while on lower side 66300 will act as a support as of now.
Commodity Calls: Get access to Commodity calls and Get Research Report Complimentary and ride the trend currently in the market. Subscribe NOW over here
Mentorship on Trading using Technical Analysis March 2021 – Early Bird ends on 10th February – Get access to this 3 months of exhaustive training and learn the science of Trading along with Risk and Money management strategies, Simple algo creation for stock selection, Elliott wave and much more. No prior knowledge, No Software required. We will ensure you get the tools necessary to become one of the finest traders – know more here