
Ather Energy Ready for Wave 5? Elliott Wave & AK Indicator Signals the Next Big Move
Jul 08, 2026
When we combine Elliott Wave Theory with simple price action, it becomes one of the most powerful trading approaches.
The biggest mistake new traders make is chasing every swing. Smart traders patiently ride the market's strongest impulsive waves.
Ather Energy Ltd Daily chart with Elliott wave and AK Indicator
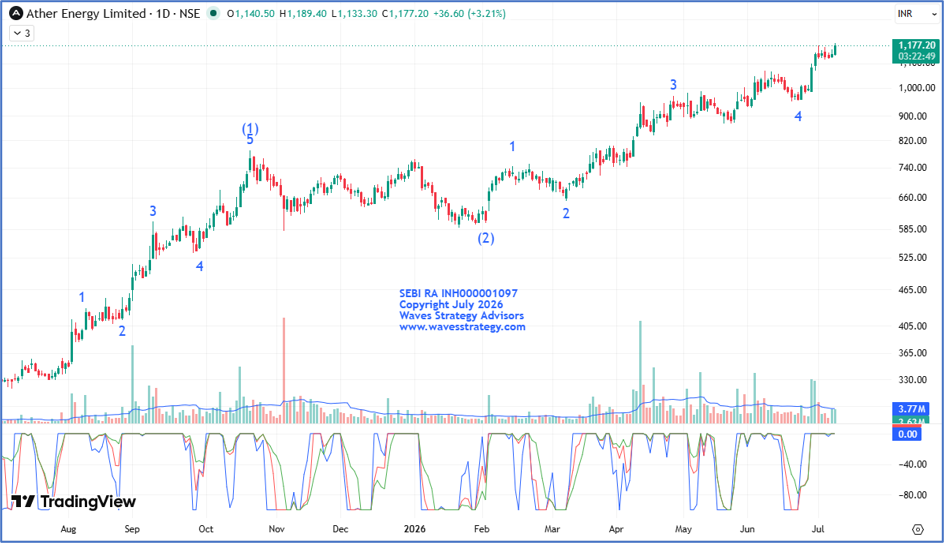
Elliott Wave acts as the market's navigation system, helping traders understand trend direction and maturity. When confirmed by price action, it often leads to high-probability trades.
Elliott Wave Indicates the Trend Is Still Intact
- Elliott Wave analysis helps assess the maturity and direction of the ongoing trend.
- Ather Energy's current price structure remains well aligned with the Elliott Wave count.
- The broader bullish trend continues to remain intact.
Wave 4 Completion Signals the Start of Wave 5
- Wave 3 was completed in April 2026, followed by a healthy consolidation.
- The stock formed Wave 4 during June 2026.
- Wave 4 appears to have ended near the 950 level.
- Price has resumed its upward journey, indicating the beginning of Wave 5.
Price Action Continues to Support the Bullish Structure
- The stock is trading in a higher highs and higher lows pattern. This structure reflects sustained buying interest.
- The ongoing price action confirms that the primary trend remains positive. Dips continue to attract buying demand, reinforcing the bullish outlook.
AK Indicator Confirms Improving Momentum
- The AK Indicator evaluates trend direction, momentum strength, and reversal probability.
- All three indicator lines are currently positioned around the zero level. This suggests that buying momentum is gradually strengthening.
- No major reversal signal has emerged, keeping the bullish bias intact.
Key Levels to Watch
- 1190 remains the immediate breakout level. A decisive close above 1190 could trigger the next leg of the rally.
- The immediate upside target stands near 1300 levels.
- 1075 levels is expected to act as a strong support level.
Conclusion
- Elliott Wave structure, price action, and the AK Indicator are all pointing in the same direction.
- The stock appears to have entered Wave 5. A sustained breakout above 1190 may pave the way for a move towards 1300 levels.
- Traders should monitor price behaviour around the breakout and support levels for confirmation before initiating fresh positions.
Learn Time Cycle Trading Through Brahmastra Mentorship
The Brahmastra Mentorship Program is designed for serious traders and investors who want to learn professional market trading techniques.
The program covers:
- Time Cycle Trading
- Elliott Wave & NeoWave Analysis
- Stock Selection Frameworks
- Algo-Based Market Strategies
- Risk Management and Trading Psychology
Limited seats are available.
Fill out the form below to learn more and become part of this transformational trading journey.