
Ather Energy: The Elliott Wave & AK Indicator Setup You Need to See!
Aug 28, 2026
Combining Elliott Wave Theory, price action and AK Indicator helps traders identify high-probability setups. Beginners chase small moves, while experienced traders focus on capturing the strongest part of the trend. By aligning wave structure with real-time price action, traders filter market noise and trade with greater confidence.
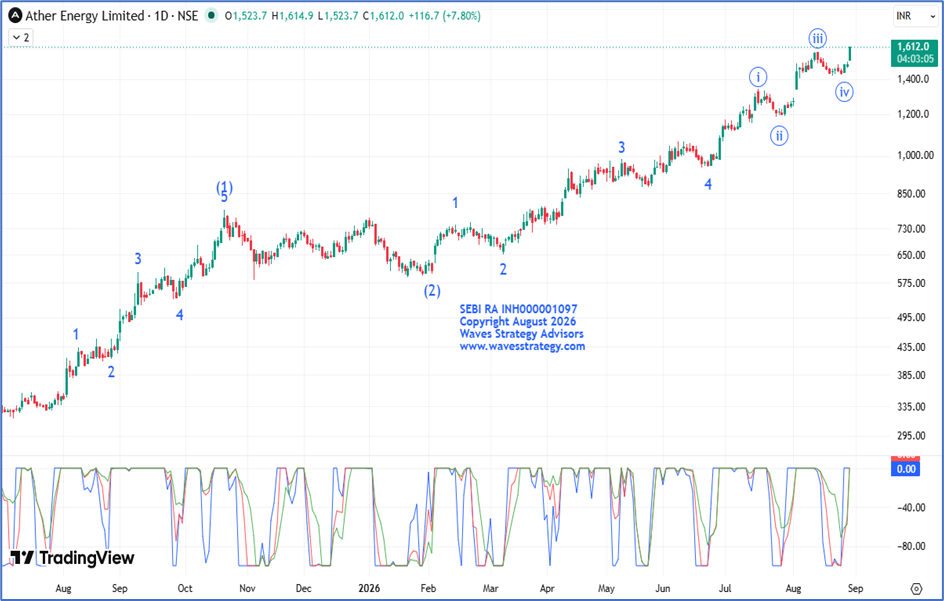
Ather Energy Ltd Daily chart with Elliott Wave and AK Indicator
Analysis
- On the daily chart, ATHERENERG can be observed heading higher, particularly since end of January 2026, indicating strong bullishness in the stock.
- Since then, the stock has delivered a whopping gain of more than 170%, forming Higher High and Higher Low structure, which is a positive sign.
Elliott wave Analysis
- As per the wave perspective, ATHERENERG completed its Primary Wave (2) in January 2026 near the 600 level.
- Post which the stock has been trading in the form of Primary Wave (3), in which stock recently completed Intermediate wave 4 back in June 2026
- Now the rise is ongoing in the form of Intermediate wave 5 which looks to be extended.
AK Indicator
- The AK Indicator is a custom-built tool used to track trend maturity, momentum and trend strength.
- On the above chart, currently all three lines of the indicator are on the still on the upside near zero line.
- This suggests bullish momentum and also reinforces the bullish setup.
Conclusion
- The combination of Elliot Wave structure, price action and AK Indicator suggests the stock is on the side of bulls.
- For now, avoid catching tops and use buy on dips approach for better risk reward as long as 1420 holds on the downside.
Brahmastra (Mentorship) on timing the market using Hurst’s Time cycles along with Elliott wave, Neo wave, complete handholding & stock selection algo creation with access to traders community. A mentor can change the learning curve that can take years to a few months. Act now, Know More
Trishul (Options Mantra – Elliott wave – Neo wave) – Trading Options using science of Keltner channel, KST, Supertrend indicator and Price action along with volume profile with Neo wave analysis scheduled on 12th – 13th September & 10th – 11th October. Limited seats only. Fill below form for more details