
AUROPHARMA: Volume Profile + Elliott Wave — What Comes Next?
Aug 31, 2026
Combining Elliott Wave Theory, Volume Profile, Price action and KST Indicator helps traders identify high-probability setups. Beginners chase small moves, while experienced traders focus on capturing the strongest part of the trend. By aligning wave structure with real-time price action and volume profile, traders filter market noise and trade with greater confidence.
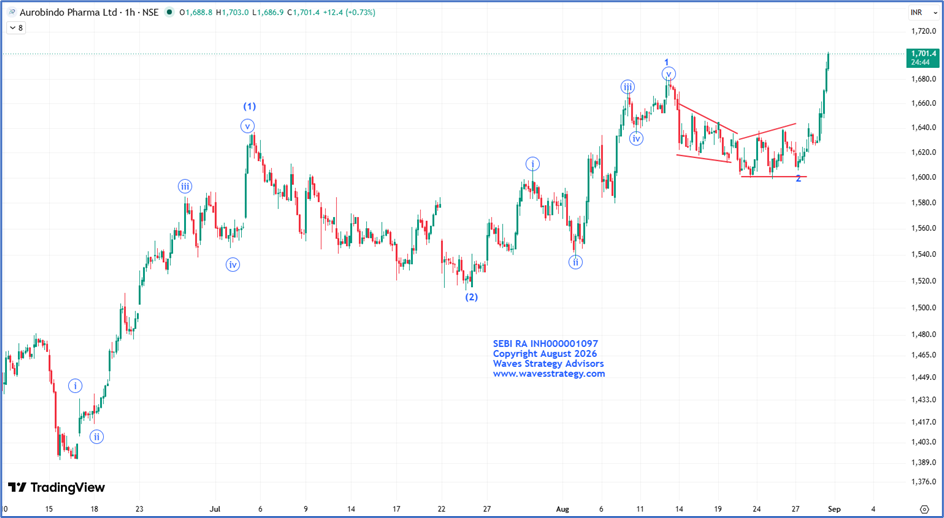
Aurobindo Pharma Ltd Hourly chart with Elliott Wave
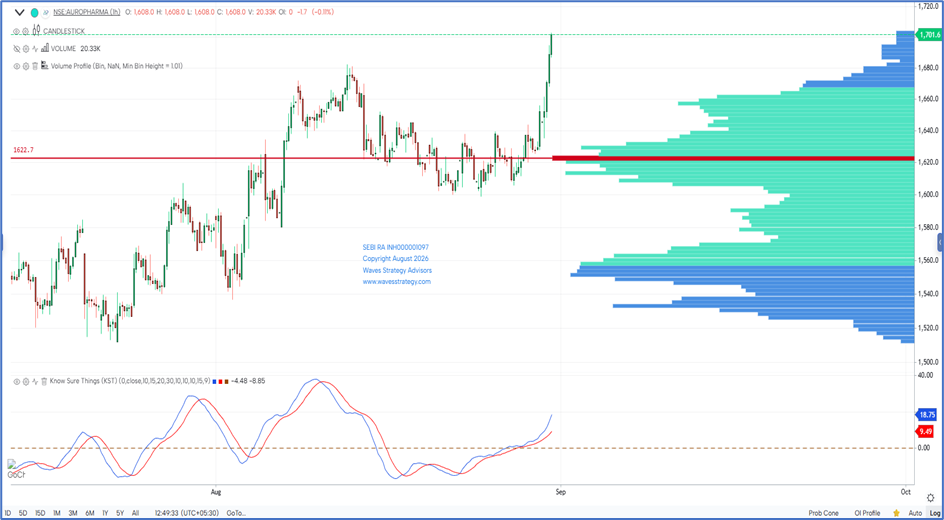
Aurobindo Pharma Ltd Hourly chart with Volume Profile & KST Indicator
Analysis
- On the hourly chart, AUROPHARMA can be observed heading higher, particularly since July 2026, indicating strong bullishness in the stock.
- Since then, the stock has gained over 12% which is a positive sign.
- A) Elliot Wave analysis
- AUROPHARMA completed its Primary Wave (2) in July 2026 near the 1520 level.
- Post which the stock has been trading in the form of Primary Wave (3), which is further subdividing in nature.
- In which the current rise is ongoing in the form of Intermediate Wave 3.
- B) Volume Profile
- Volume Profile is an advanced analytical tool that displays the price levels where significant trading activity has occurred.
- It helps traders identify areas of high and low market participation based on trading volume.
- POC represents the price level with the highest traded volume. It acts as a magnet level, where the price tends to revisit frequently.
- It can also help to identify strong support and resistance zones and can improve entry and exit precision.
- C) KST Indicator
- The KST (Know Sure Thing) Indicator is a momentum-based indicator. It helps traders assess the overall strength and direction of price movement.
- When the KST line crosses above the Signal line → Early sign of bullish momentum.
- When it moves above the Zero line → Confirms strengthening of bullish momentum.
- It is particularly useful for identifying trend shifts and momentum confirmation.
- On the above chart, currently KST line crossed above zero line and are still on the upside. This suggests improving momentum.
Conclusion
- Recently, stock tested POC level on 28th August 2026 near 1620 level and reversed sharply on the upside which is a positive sign and also highlights reliability on POC level which has acted as a strong support level.
- Price action, Volume Profile and KST Indicator point towards a strong setup.
- For now, dips towards 1680 can be considered as a buying opportunity to participate in the ongoing uptrend.
- 1620 remains a crucial support level to watch in the near term.
Brahmastra (Mentorship) on timing the market using Hurst’s Time cycles along with Elliott wave, Neo wave, complete handholding & stock selection algo creation with access to traders community. A mentor can change the learning curve that can take years to a few months. Act now, Know More
Trishul (Options Mantra – Elliott wave – Neo wave) – Trading Options using science of Keltner channel, KST, Supertrend indicator and Price action along with volume profile with Neo wave analysis scheduled on 12th – 13th September & 10th – 11th October. Limited seats only. Fill below form for more details