AVADHSUGAR - Price Patterns with Indicators to gauge the directional move
Mar 14, 2022
Like this Article? Share it with your friends!
Trading can be very simple with the application of basic technical analysis but provided that it is in the right context. Here, the ADX was applied to gauge the trending nature of the stock.
Look at the below chart of AVADHSUGAR that shows the forecast done on 14th March 2022 in the morning research report "The Financial Waves short term update" before equity markets open.
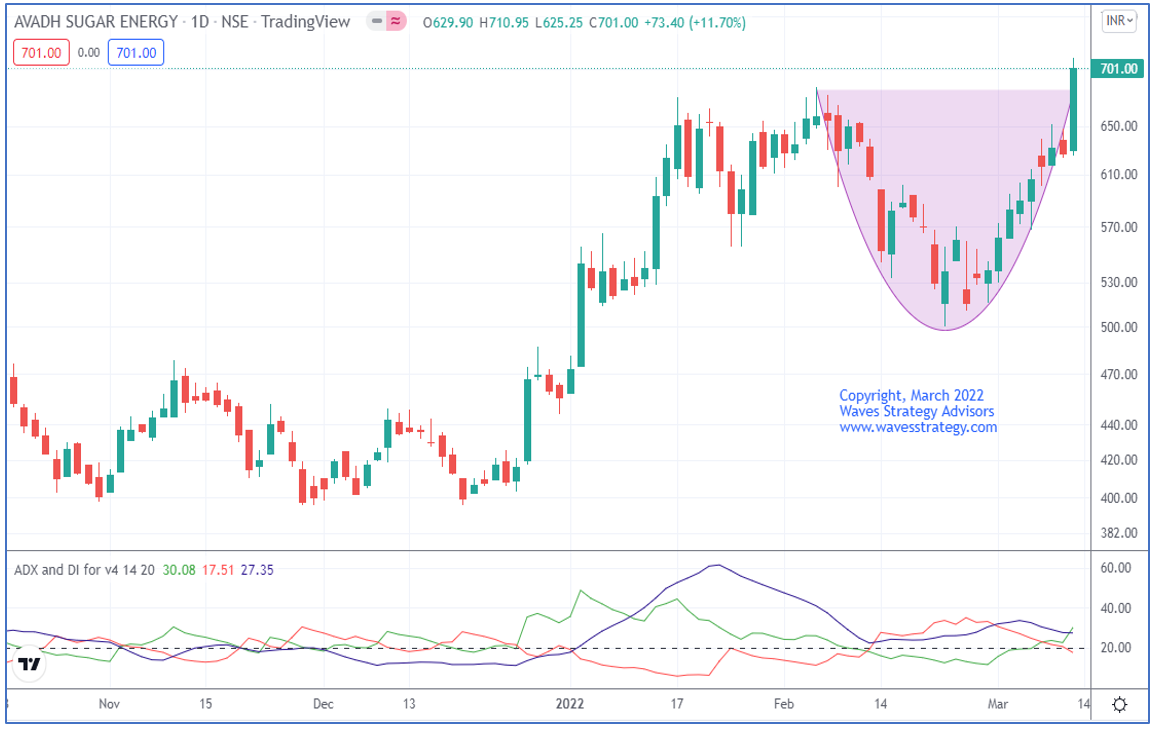
AVADHSUGAR Daily chart: (Anticipated as on 14th March 2022)
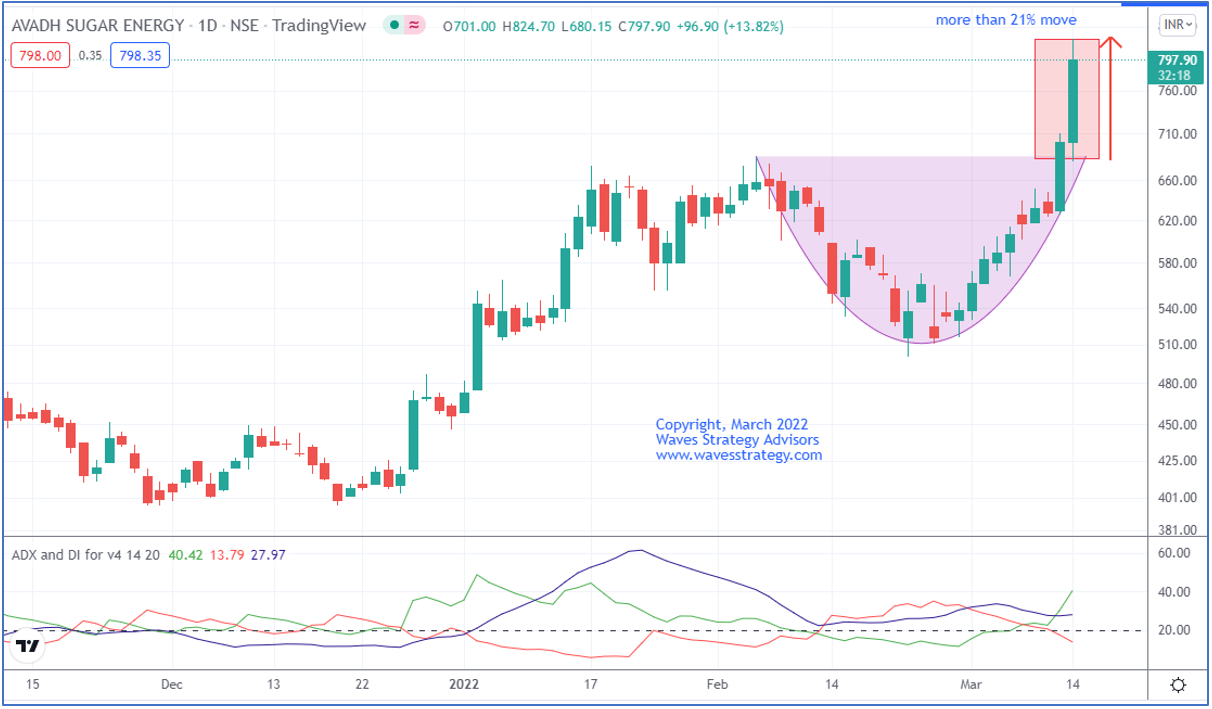
AVADHSUGAR Daily chart: (Happened as on 14th March 2022)
Wave analysis as we published on 14th March 2022
On the daily chart, in the previous session prices formed a bullish candle. Price has closed above 684 levels which confirm breakout of rounding bottom pattern. We have shown ADX indicator which gives an indication if the stock is trending or in a trading range. The low readings of ADX indicate that the stock is in a range. The ADX of this stock is 27.35 giving an indication of a trending market. The reading above 25 means strong directional strength.
In short, trend for this stock is positive. Use dips towards 680-685 as buying opportunity for a move towards 755-760 levels as long as 660 holds on the downside
Happened
After we published the report today morning, the stock precisely made the dip towards the 680 levels and made the new high near 824 levels by making move of more than 21% in a single day.
Mentorship on Timing the Markets – Upcoming mentorship program starting from March end will be focussing on these simple and powerful trade setups that can simply amaze you by using tools of Options. You will be able to trade markets with confidence, conviction, no anxiety and in any direction. Be a part of this wonderful journey that will transform you as a trader. Below is feedback from our Mentees. Fill the form below for more details