
Azad Engineering could Be Preparing for Its Next Explosive Move!
Oct 07, 2026
Combining Elliott Wave Theory, price action, Time Cycle and AK Indicator helps traders identify high-probability setups. Beginners chase small moves, while experienced traders focus on capturing the strongest part of the trend. By aligning wave structure with real-time price action, traders filter market noise and trade with greater confidence.
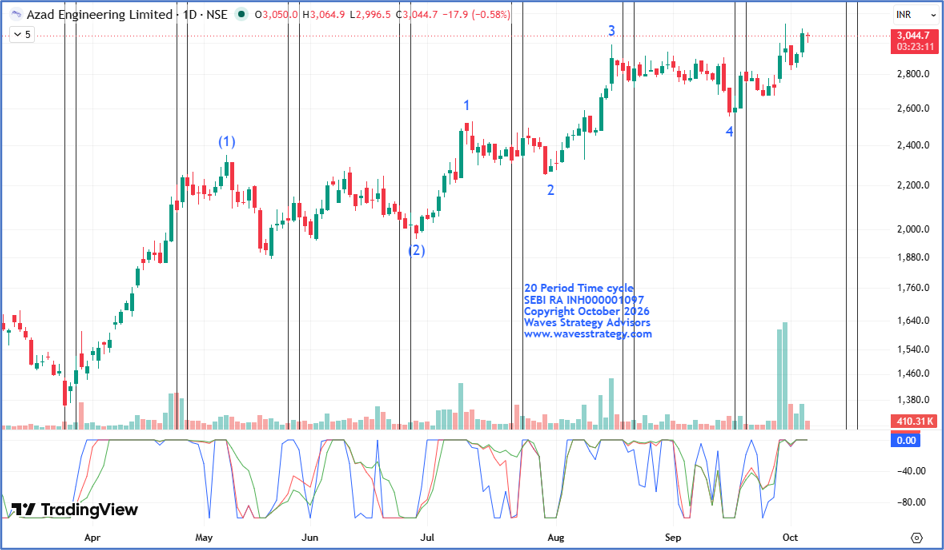
Azad Engineering Daily chart with Elliot Wave and Time Cycle
Analysis
- On the daily chart, Azad Engineering Ltd can be observed heading higher, particularly since beginning of March 2026, indicating strong bullishness in the stock.
- Since then, the stock has delivered a whopping gain of more than 125%, forming Higher High and Higher Low structure, which is a positive sign.
Elliott wave Analysis
- As per the wave perspective, prices completed its Primary Wave (2) in June 2026 near the 1960 level.
- Post which the stock has been trading in the form of Primary Wave (3), in which stock recently completed Intermediate wave 4 in September 2026.
- Now the rise is ongoing in the form of Intermediate wave 5 of (3) which looks to be extended.
AK Indicator
- The AK Indicator is a custom-built tool used to track trend maturity, momentum and trend strength.
- On the above chart, currently all three lines of the indicator are still on the upside at zero line.
- This suggests bullish momentum is likely to continue.
Time Cycle
- Time cycles are fractal in nature, meaning they can be applied effectively across multiple time frames.
- 20-period Time cycle has been performing exceptionally well on the daily chart, consistently identifying high-probability turning points.
- The most recent cycle was on 17th September 2025 and prices made a short-term low exactly near the Time cycle window around 2550 levels and since then the stock has surged nearly 23% and closed above prior swing high near 3000 which has turned the cycle on the buy side.
Conclusion
- The combination of Elliot Wave structure, price action, Time Cycle and AK indicator suggests the trend is on upside.
- A decisive move above 3130 can extend this rally further to 3300 or higher.
- On the downside, 2825 remains a crucial support level to watch in the near term.
Brahmastra (Mentorship on Timing the market) -
Learn to time the market to the very Day, Hour and Minute by combining the concepts of Hurst’s Time cycle on Index and stocks as well, Gann square of 9, Elliott wave, Neo wave and be a part of elite trader’s community who are Time Traders. Fill the form Now
Trishul Membership –
Options Trading with Elliott wave, Neo wave, Ichimoku cloud, and sacred science of trading & forecasting is covered in the Options Mantra Live Sessions – Online Session & Sutra of Waves Live Session – 10th – 11th October. Limited seats only. Fill the below form: