
Bajaj Auto: Rally Isn't Over Yet? Elliott Wave Reveals What's Next!
Jul 22, 2026
Blending Elliott Wave Theory with price action helps traders spot high-probability trading opportunities.
Check out the research below on BAJAJ_AUTO
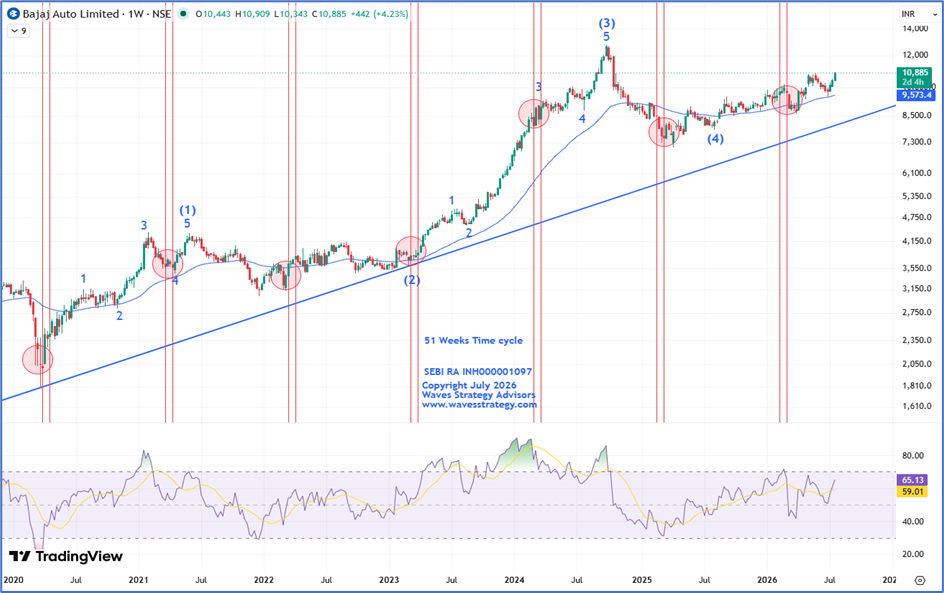
BAJAJ_AUTO Weekly chart as on 22nd July 2026
Analysis
- The stock has been following a classic Elliott Wave pattern since March 2020.
- In which, post completing its Primary wave (3) on the upside the stock recently completed its primary wave (4) near the 7900 level in form of an Extracting Triangle pattern and now the rise is ongoing in the form of wave (5).
- Wave (5) is unfolding on the upside in the form of Terminal impulse (3-3-3-3-3).
51 Period Time cycle
- The stock has been following a 51 Period Time cycle consistently making temporary lows and bouncing back on the upside.
- The most recent cycle was on 16th Feb’26 – 02nd March’26 where the stock formed a low near the 8700 level and has reversed by more than 24% since then signalling a major importance in catching the bottom.
- The stock has also broken above the prior swing high indicating that the cycle has already turned on the buy
Overall outlook
- BAJAJ_AUTO is currently trading within the Primary wave (5).
- This combination of Elliott Wave structure, price action indicates a strong technical setup.
- For now, traders should use buy on dips strategy as long as 9500 levels stays protected on the downside.
Brahmastra Mentorship – Learn the Science of Timing the Market
Master the practical application of Elliott Wave, Neo Wave, Time Cycles, market timing, stock selection, risk management, and professional trading strategies through our comprehensive three-month Brahmastra Mentorship Program.
The next batch begins in July 2026, and seats are limited.
Fill in the form below to receive complete program details.