
Bajaj Finance: Is Wave 2 Nearing an End or Is More Pain Ahead?
Sep 15, 2026
Combining Elliott Wave Theory, price action and AK Indicator helps traders identify high-probability setups. By aligning wave structure with real-time price action, traders can filter market noise and focus on capturing the strongest part of the trend.
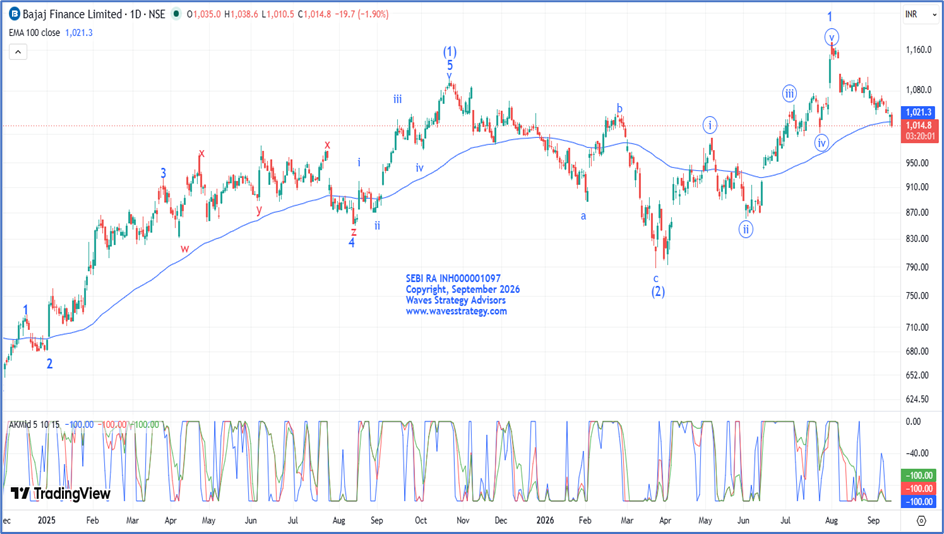
Bajaj Finance Ltd Daily chart with Elliott Wave and AK Indicator
Price action
- On the daily chart, BAJFINANCE can be observed heading downside, particularly since beginning of August 2026, indicating bearishness in the stock.
- Since then, the stock has declined by almost -14%, in the form of Lower High and Lower Low structure.
- Also, prices have broken below the 100 EMA for the first-time post May 2026 which is a negative sign.
Elliott wave Analysis
- As per the wave perspective, BAJFINANCE completed its Primary Wave (2) in March 2026 near the 800 level.
- Post which the stock has been trading in the form of Primary Wave (3), in which stock recently completed Intermediate wave 1 on 3rd August 2026.
- Now the fall is ongoing in the form of Intermediate wave 2. The internal pattern remains unclear and further price action is much needed to confirm the same.
AK Indicator
- The AK Indicator is a custom-built indicator which is used to track trend maturity, momentum and trend strength.
- On the above chart, currently all three lines of the indicator are on the on the downside near -100 line.
- This suggests bearish momentum and also reinforces the bearish setup.
Conclusion
- The combination of Elliot Wave structure, price action and AK Indicator suggests that the stock is on the side of bears.
- For now, a further break below the 1010 level can drag prices lower as long as 1075 holds on the upside.
Brahmastra (Mentorship) on timing the market using Hurst’s Time cycles along with Elliott wave, Neo wave, complete handholding & stock selection algo creation with access to traders community. A mentor can change the learning curve that can take years to a few months. Act now, Know More
If you want to go beyond individual market forecasts and learn a systematic approach to analysing stocks and options, our Trishul Membership combines multiple technical-analysis techniques into one framework.
The program covers:
- Keltner Channel + KST applied directly to options charts
- Neo Wave for understanding market structure and forecasting
- Ichimoku Cloud for trend and momentum analysis
- Practical methods for analysing stocks and options
Trishul Membership — 3 Months
Limited seats are available.
Fill in the form below for more details.