Bank Nifty 5 minutes Cycle with Elliott Wave
Jun 17, 2020Bank Nifty application of Elliott wave on a 5 minutes chart is showing amazing pattern. This when combined with Time Cycles provides the much needed conviction to pull the trigger.
See the below chart of Bank Nifty and it does not need much explanation. As we always say irrespective of the news or events the pattern works out very well.
Latest event of India China standoff and tensions over border has not resulted into any significant change in the trend. Over short term there was a spike down but that was also only temporary and Nifty along with Bank Nifty recovered back sharply.
Bank Nifty 5 minutes chart: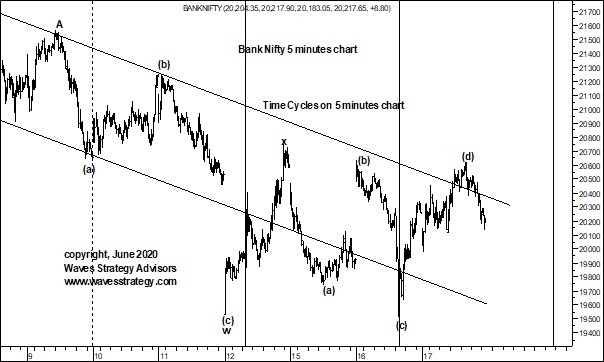
Elliott wave:
Bank Nifty has been exhibiting very clear Elliott wave patterns and prices seem to be moving int eh form of wave (e). This can be a Neutral Triangle pattern.
Simply imagine the clarity on a 5 minutes chart when majority are struggling to understand the reason for selloff followed by rise.
Above that the Time Cycles on 5 minutes chart looks simply superb and if one can time the turn with the Elliott Wave pattern the accuracy will be sky rocket.
We will mention the periodicity and key levels to trade this pattern in our daily morning research report – The Financial Waves Short term update. Get access to it if you would like to capture the next big trend which is now due to emerge very soon. Get access over here
3 Months of Mentorship starts in 3 days – Learn the application of these Cycles along with Elliott wave and Neo wave patterns and we will ensure you have the necessary tools to sail through the market volatility even if you have no prior knowledge of trading. Know more here