
Bank Nifty Below 55000: Is More Downside Ahead as Time Cycle Nears?
Sep 28, 2026
Advanced Neo Wave analysis when combined with price action Time Cycle and Gann Square of 9 can provide a useful framework for identifying potential turning points and trade setups from a short- to medium-term perspective.
Bank Nifty Daily chart with Neo Wave
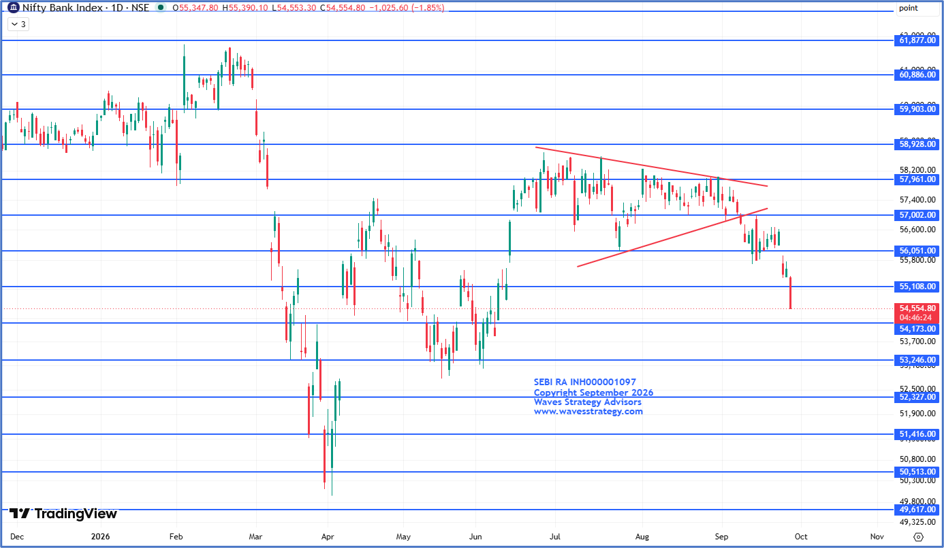
Bank Nifty Daily chart with Gann Square of 9
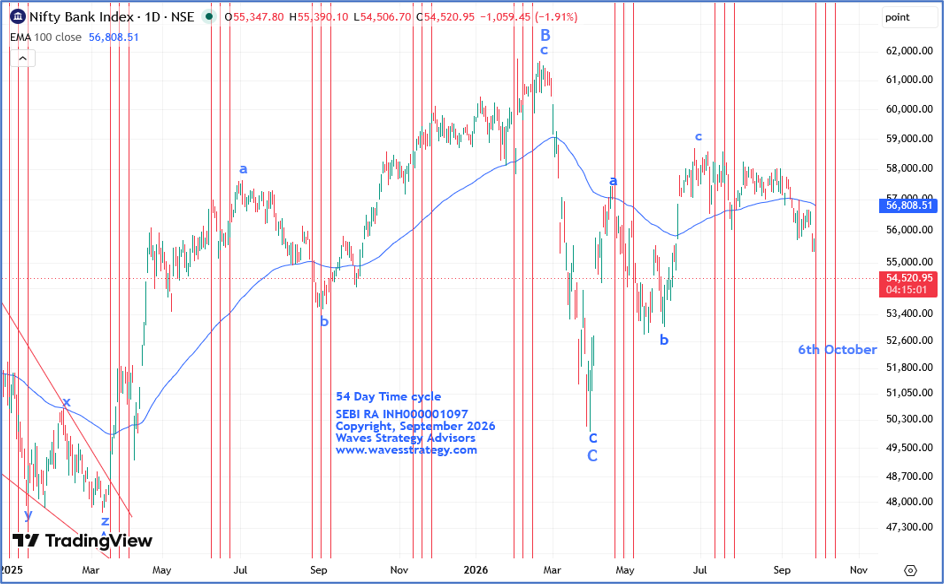
Neo Wave and Time Cycle analysis
- From a wave perspective, the rise from March 2025 to February 2026 appears to have unfolded as a corrective Zigzag, indicating that the move was corrective rather than a sustained impulsive trend.
- The correction appears to have completed Wave B near the lifetime high of 61700, after which Bank Nifty witnessed a sharp decline in Wave C.
- The current rise is overlapping in nature, indicating a possible Triangle or Diametric pattern.
- Bank Nifty is also approaching its 54-period Time Cycle which is starting today with the main cycle due around 6th October 2026, during which prices are likely to remain under pressure.
- The cycle zone will therefore be important for monitoring as short term low formation is expected.
Gann Square of 9
- The horizontal lines represent Gann Square of 9 levels, which have repeatedly acted as support and resistance.
- In today’s session, the index broke below the 55108 Gann level, indicating weakness and shifting focus towards the next key level at 54173.
- The combination of Time Cycles and Gann levels can help identify important price-time relationships and provide a framework to understand the market’s underlying structure.
Conclusion:
- In a nutshell Bank Nifty remains in a sell-on-rise mode, with 54173 as the next key Gann support. The recent breakdown below 55108 keeps the structure weak. Fresh buying should be avoided unless the index sustains a close above 55400 levels.
Learn Advanced Technical Analysis with Brahmastra
Brahmastra — Technical Analysis Mentorship
Learn the science of trading with algo creation, stock selection, options trading, Elliott Wave and Neowave.
In the Brahmastra sessions, you will learn how these concepts can be combined to develop a structured approach to market analysis and trading. Know more
Advanced Technical Analysis Training — Elliott Wave, Neowave & Options
Our 3-month Trishul Advanced Technical Analysis Training focuses on Elliott Wave and Neowave concepts along with powerful options strategies.
Learn the complete science of trading using the principles of Elliott Wave, Neowave and options, including techniques for market forecasting and identifying potential market structures.
The next session is scheduled for 10th and 11th October, Saturday and Sunday.
Limited seats only. Fill the form below for more details.