Bank Nifty Trading using Elliott wave with Time cycles
Sep 09, 2025
Bank Nifty Elliott wave pattern along with Time can provide probable areas of reversal.
Elliott wave is GPS of the market that shows probable path that prices can follow. Time cycle helps to understand the area from where prices can probably reverse.
Bank Nifty daily chart: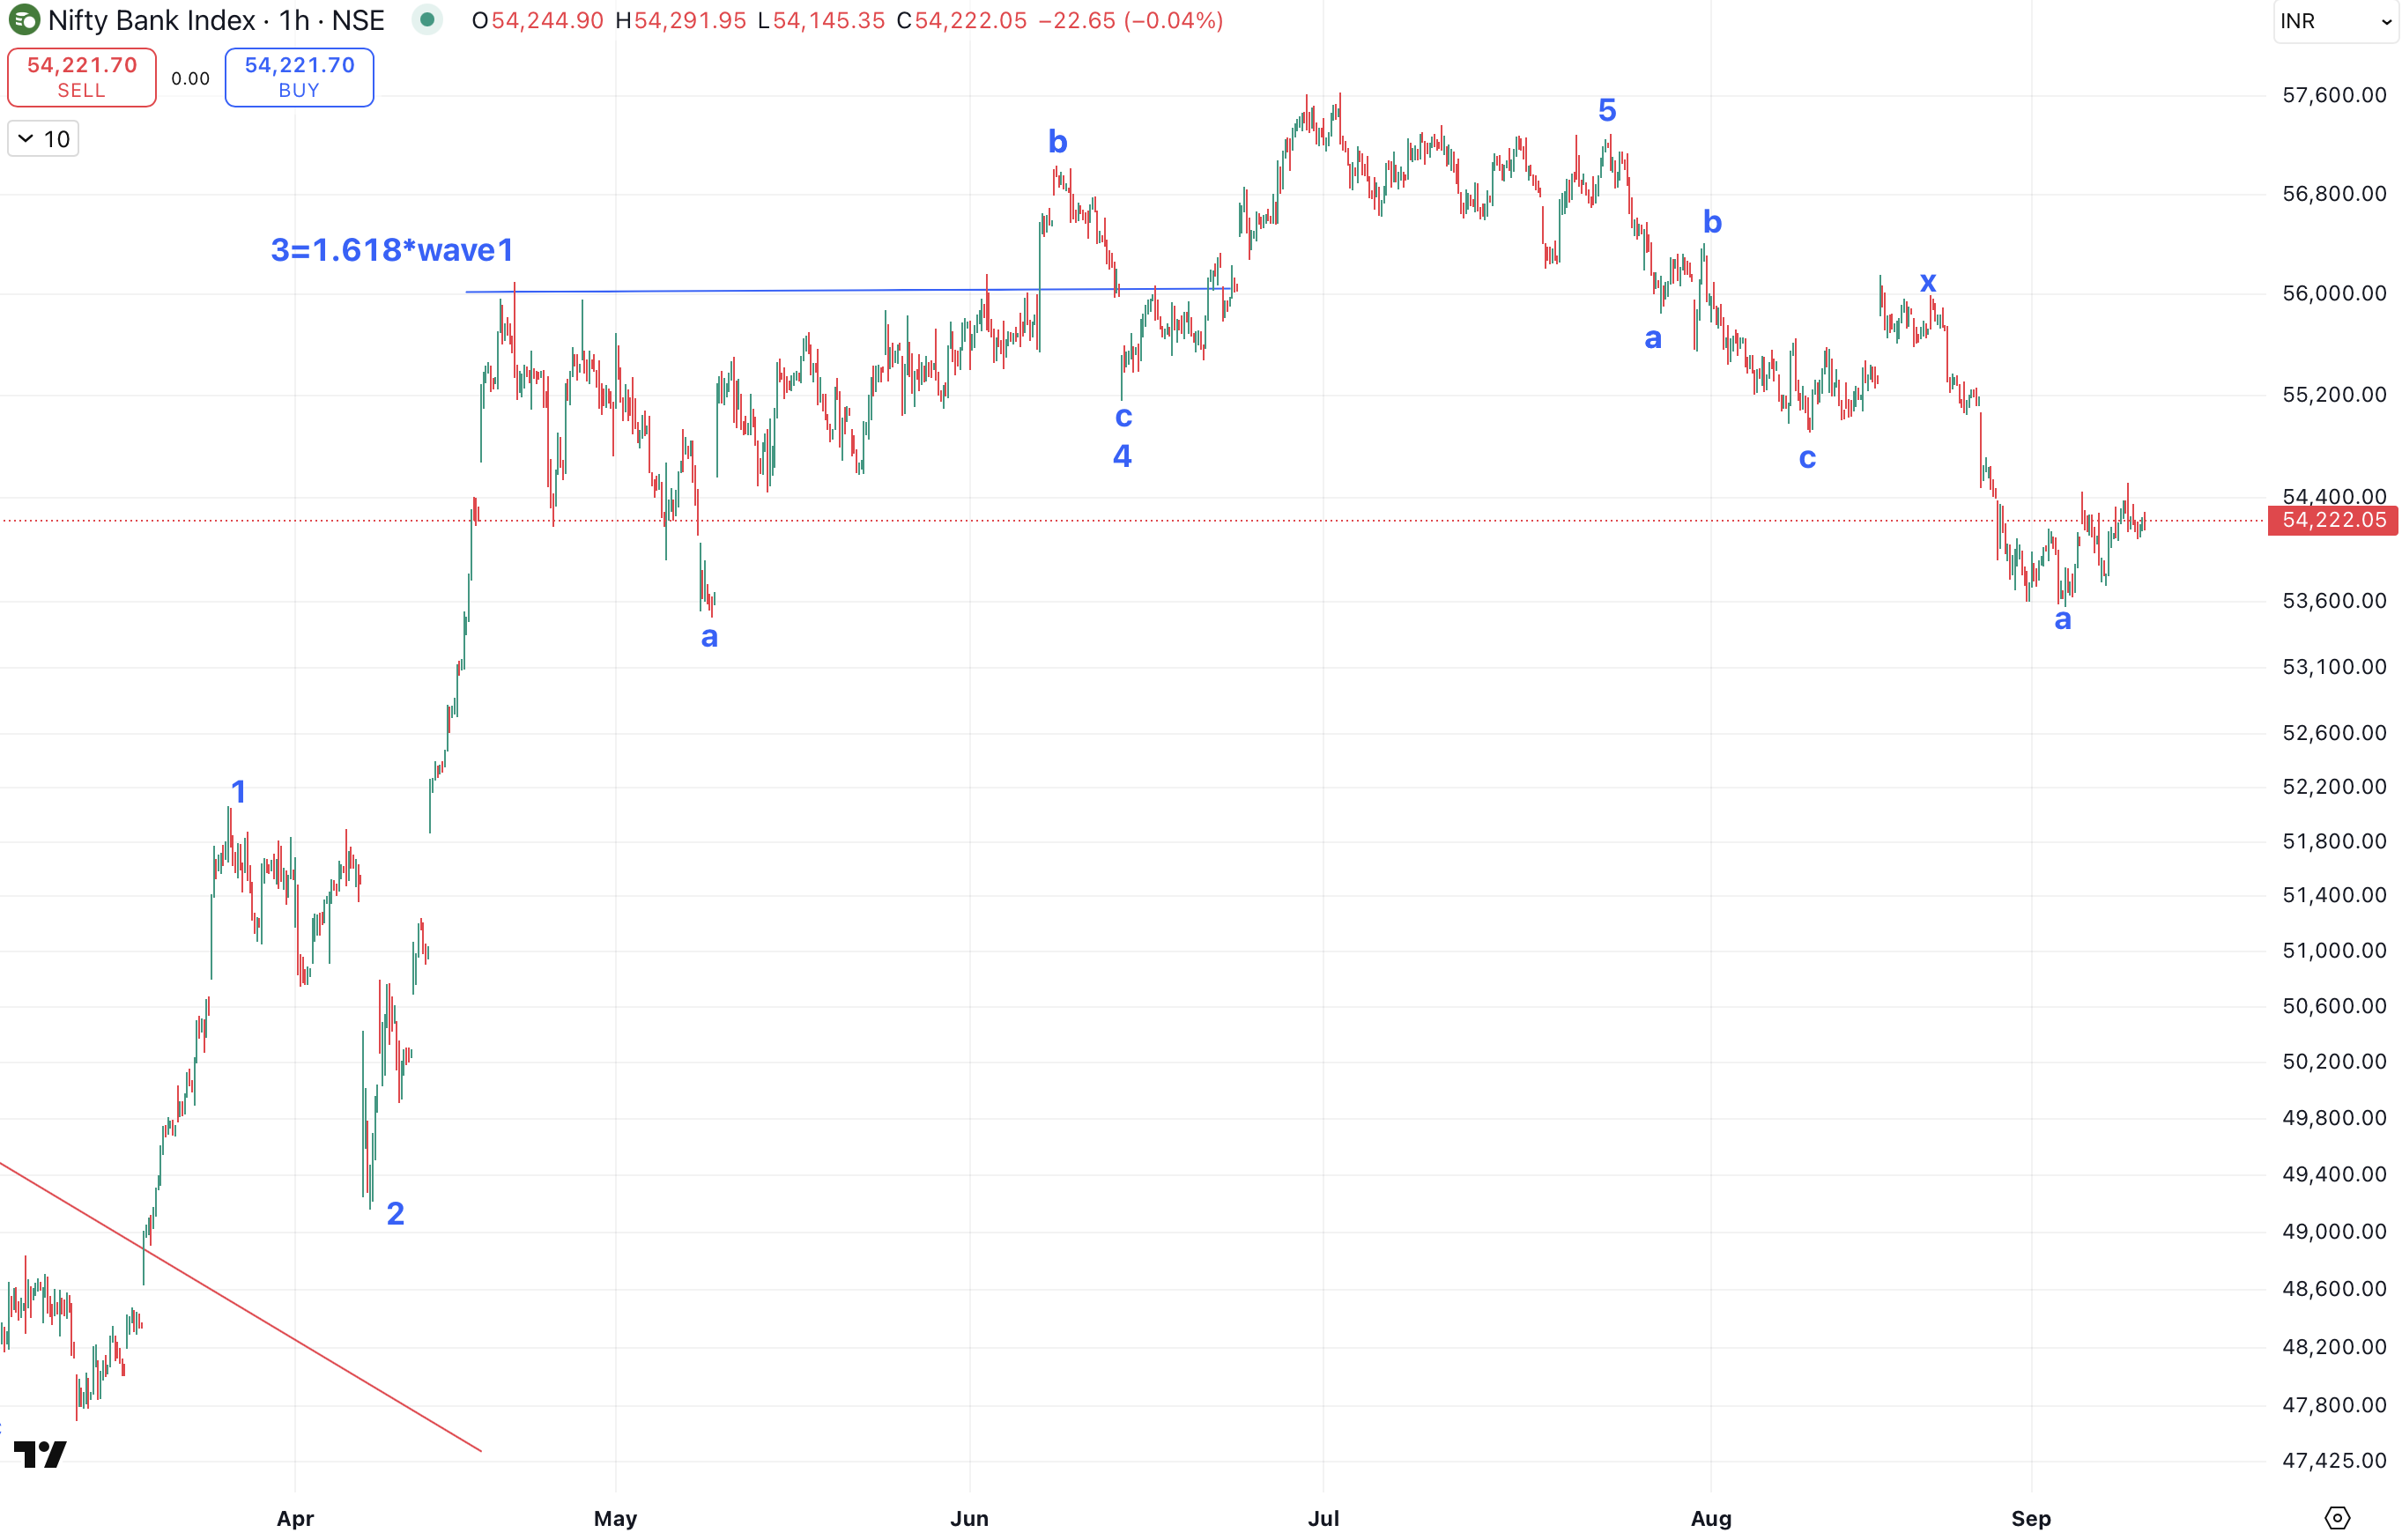
Bank Nifty hourly chart: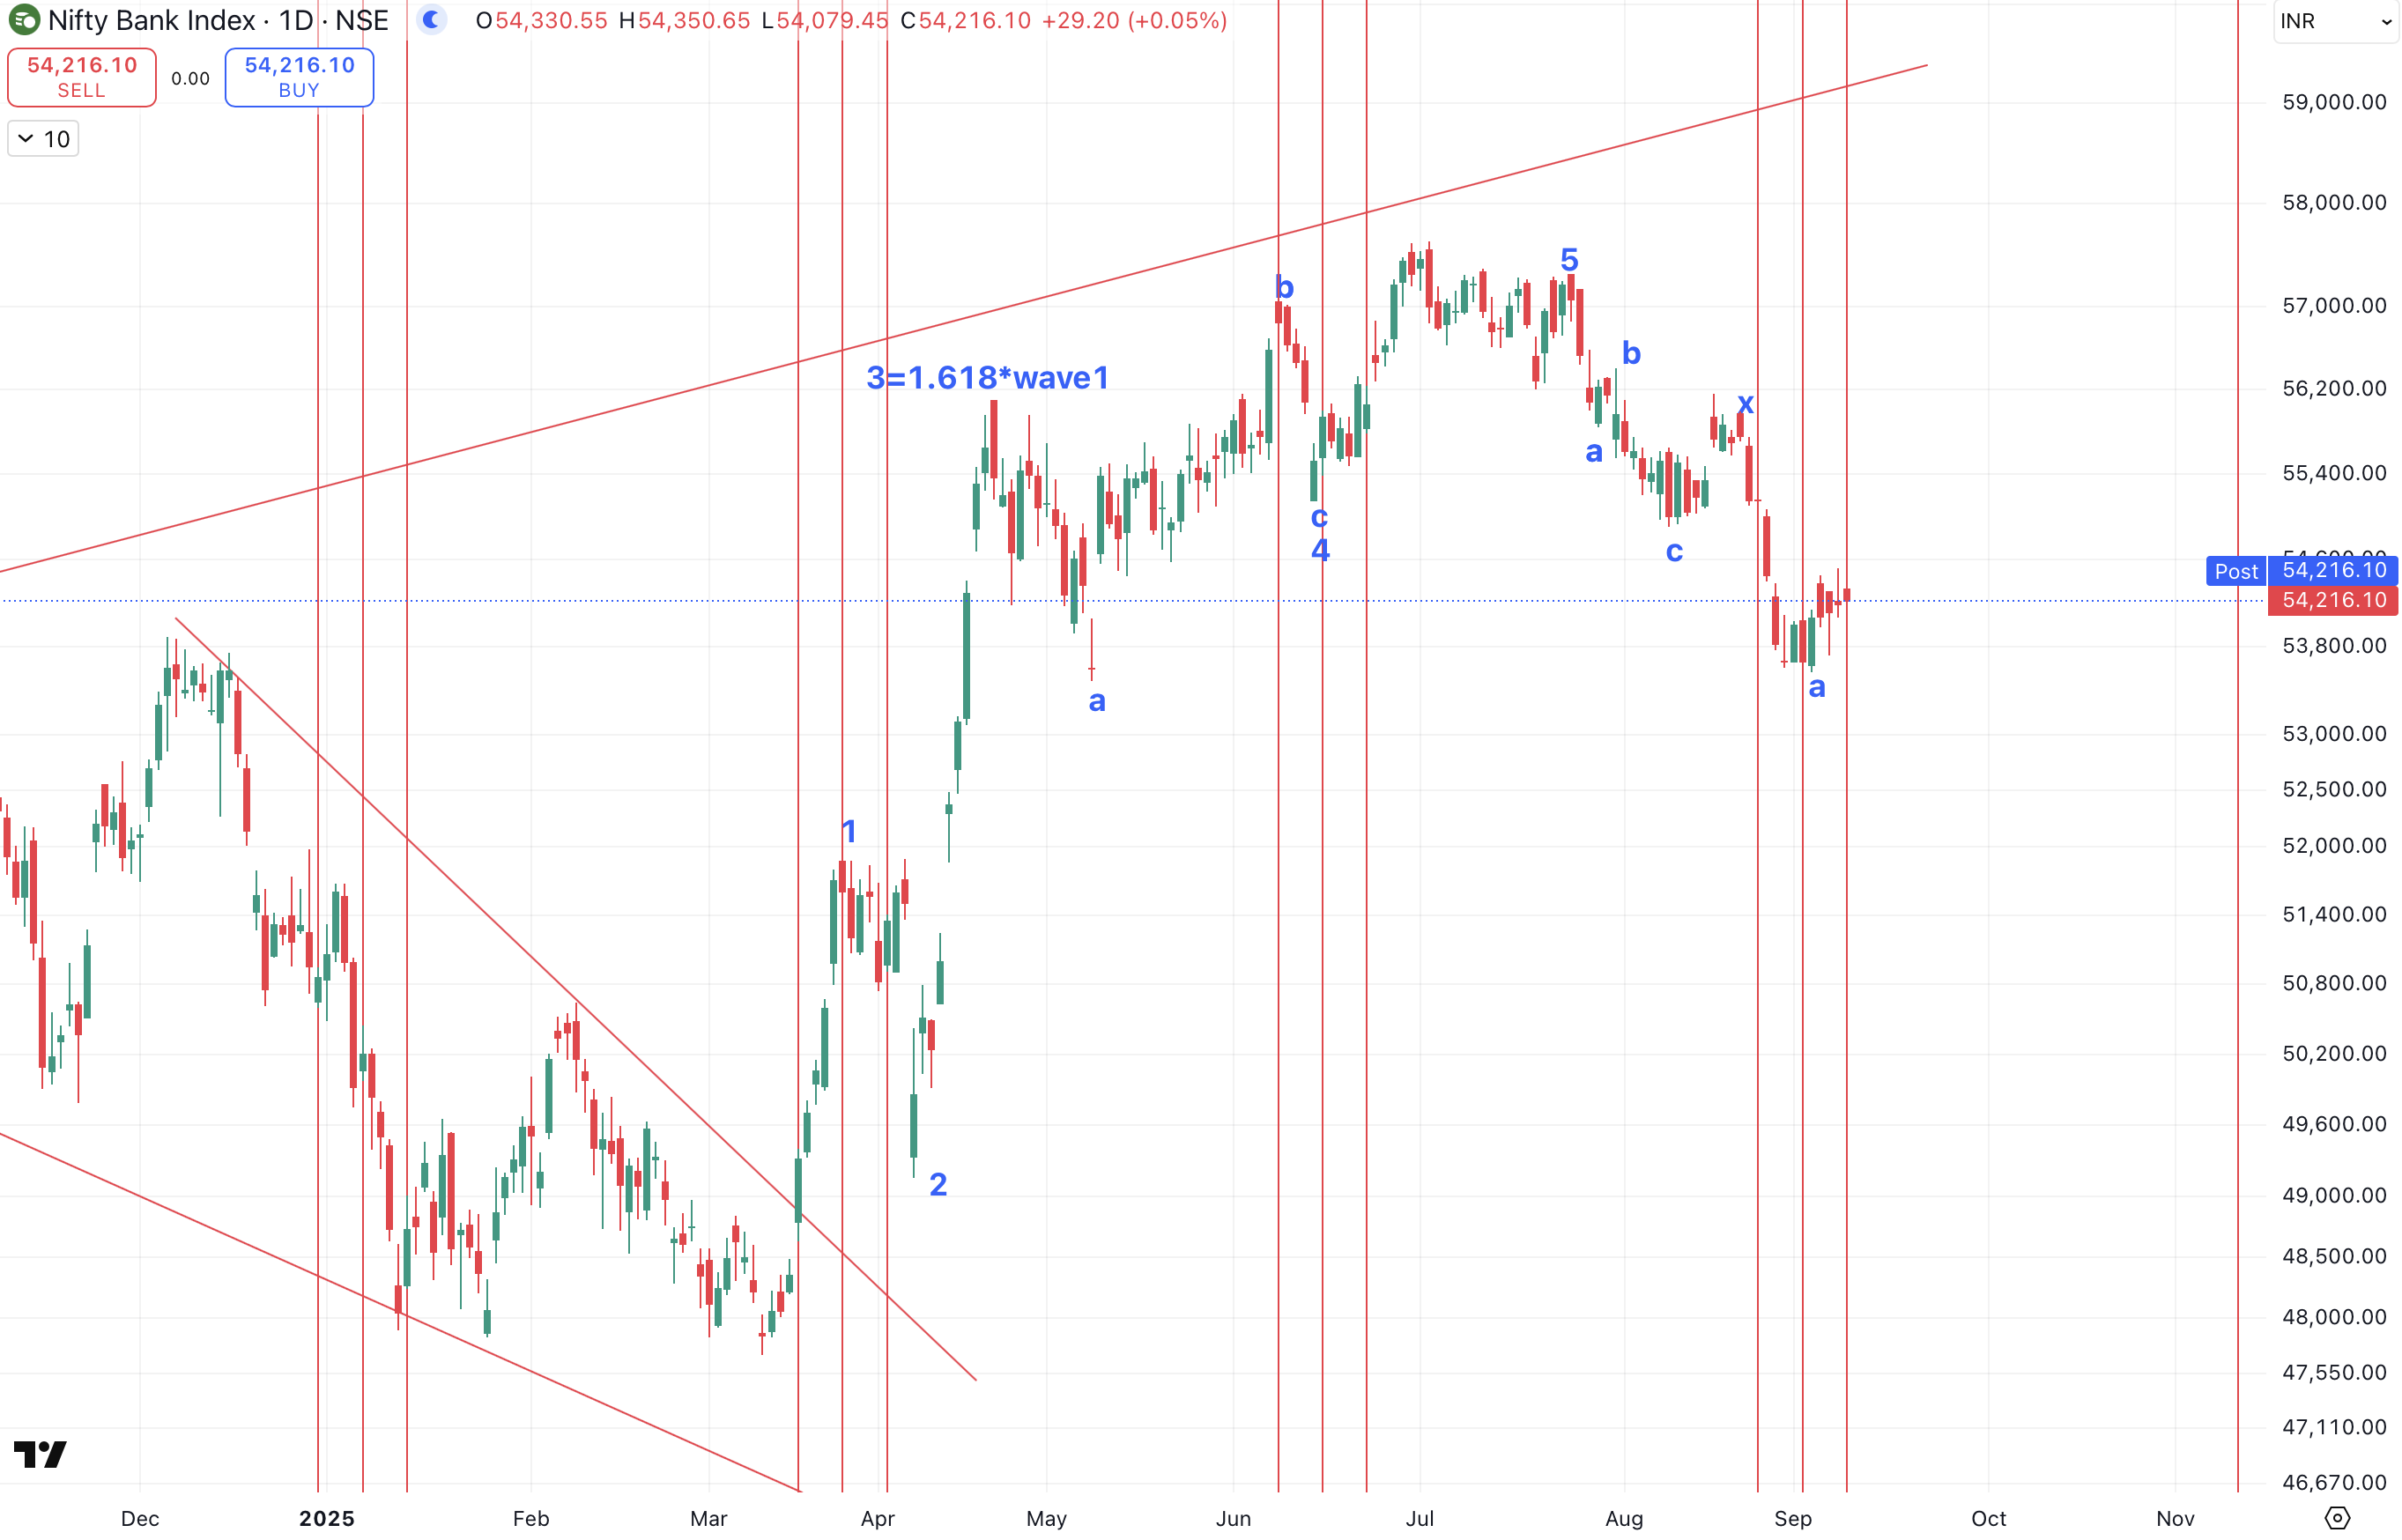
Elliott wave analysis: Bank Nifty daily chart shows 54 days Time cycle that this index follows. Prices have been reversing on upside from this cycle zone. It has currently again come near the same area. However, we are yet to see positive price action. Break above 55550 will provide 1st confirmation that prices and time are in sync.
As per Elliott wave prices are moving in form of wave b after completing wave a at the lows. This indicates that the upside momentum can be slower and might not move beyond 56000 levels. The up move will be only wave b and there can be again a move on downside in form of wave c.
Pattern analysis is crucial aspect of Elliott wave. As per this prices can possibly form Triangle or Flat pattern. This is derived by looking at time cycle which is showing upside thrust over short term as long as 53560 is intact.
In a nutshell, Bank Nifty is at crucial juncture. Break above 55550 levels will bring price and time in sync for a move to 55200 or higher levels. Any breach below 53560 will be a sign of concern.
3 months of Mentorship (Brahmastra) on Timing the market – Equip yourself with methods and techniques of Time cycles with Elliott wave patterns that actually work, Mentorship starts soon with only limited seats. Learn to derive targets, stoploss and time it to the very Day, Hour, and Minute. Limited seats only. Fill below form for more details: