
Bank Nifty Creating a Base: Is It Gearing Up for the Next Big Move?
Aug 20, 2026
Neo Wave helps to understand the rhythm of the market by identifying probable future price action ahead of time with disciplined execution, it becomes a powerful tool for tracking trends across equities, indices, and commodities.
Combining it with Volume profile and KST indicator can provide clear guidance for trading in stocks and indices over short to medium term and also helps to create powerful, high-probability trading setups with improved accuracy.
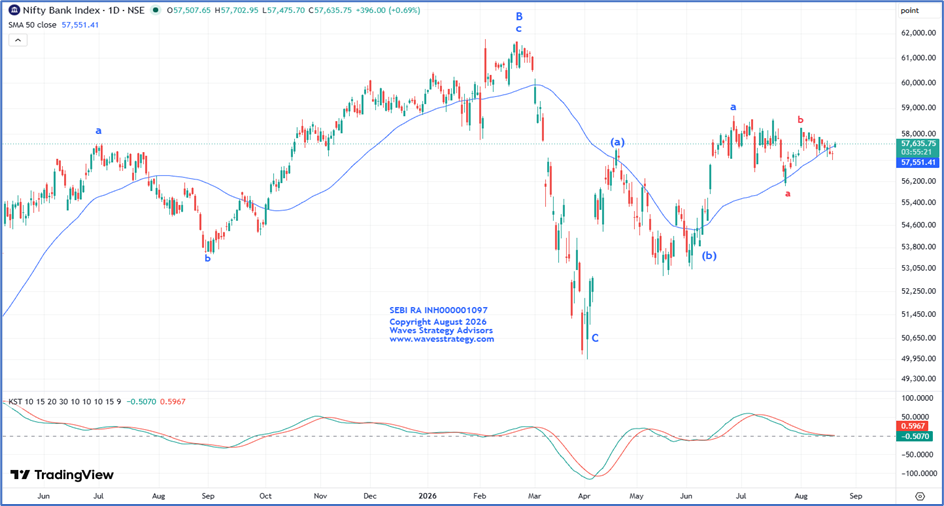
BANKNIFTY Daily chart with Neo Wave and KST Indicator
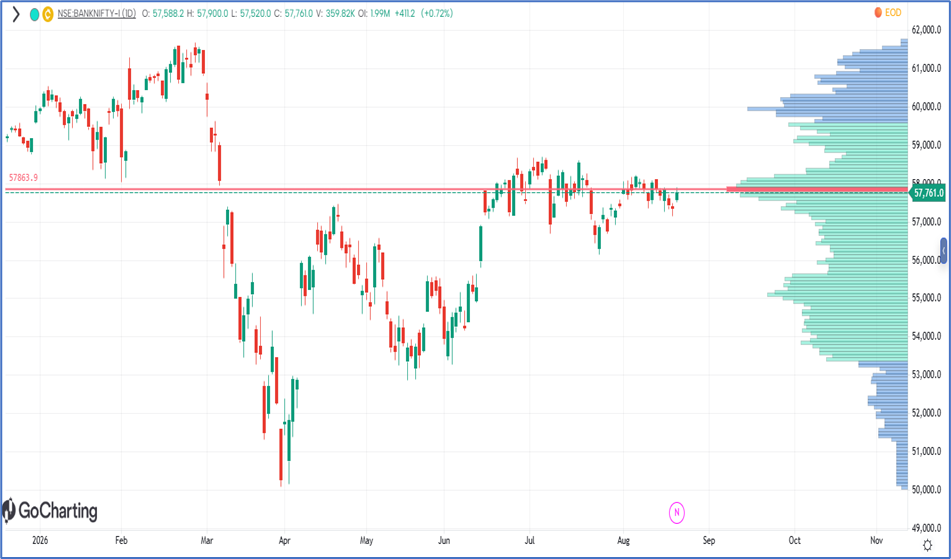
BANKNIFTY Daily chart with Volume Profile
Understanding Volume Profile
- Volume Profile is an advanced analytical tool that displays the price levels where significant trading activity has occurred.
- It helps traders identify areas of high and low market participation based on trading volume.
- POC represents the price level with the highest traded volume. It acts as a magnet level, where the price tends to revisit frequently.
- It can also help to identify strong support and resistance zones and can also improve entry and exit precision.
Neo Wave Structure
- From a wave perspective, the rise since June 2026 is unfolding as wave (c).
- In which, wave a got completed near 58700 on 25th June 2026 and now the next wave i.e., wave b is probably unfolding in the form of Flat corrective pattern as internal wave b (red) of b has retraced more than 8% of wave a (red). Currently wave c (red) of wave b is unfolding on the downside.
Understanding KST indicator
- The KST (Know Sure Thing) indicator is a momentum-based indicator.
- It helps traders assess the overall strength and direction of price movement.
Combining Volume Profile & KST indicator
- Currently, prices are hovering around the 50 period SMA (Simple Moving Average), indicating a lack of clear directional momentum
- Also, the market remains largely sideways, with no strong breakout or breakdown visible, momentum remains weak as price continues to consolidate around the SMA.
- KST indicator is also suggesting a consolidation phase, supporting our sideways stance in the index.
Conclusion
- The combination of Neo Wave structure, price action, and Volume profile suggests that the index is currently in consolidation phase.
- A decisive move above the POC level 57864 may trigger the next leg of the rally.
- 57000 remains a crucial support level to watch in the near term
Brahmastra (Mentorship) on timing the market using Hurst’s Time cycles along with Elliott wave, Neo wave, complete handholding & stock selection algo creation with access to traders community. A mentor can change the learning curve that can take years to a few months. Act now, Know More
Trishul (Options Mantra – Elliott wave – Neo wave) – Trading Options using science of Keltner channel, KST, Supertrend indicator and Price action along with volume profile with Neo wave analysis scheduled on 12th – 13th September & 10th – 11th October. Limited seats only. Fill below form for more details