Bank Nifty Hits Crucial Fibonacci Support — Reversal or More Pain?
May 18, 2026
Neo Wave works like a market GPS — highlighting the most probable price paths with clarity. Its real strength lies in anticipating major moves before they happen across indices, stocks, and commodities. Used with discipline, it doesn’t just read the market — it forecasts it with precision.
The analysis below is from our monthly report published on 24th April 2026.
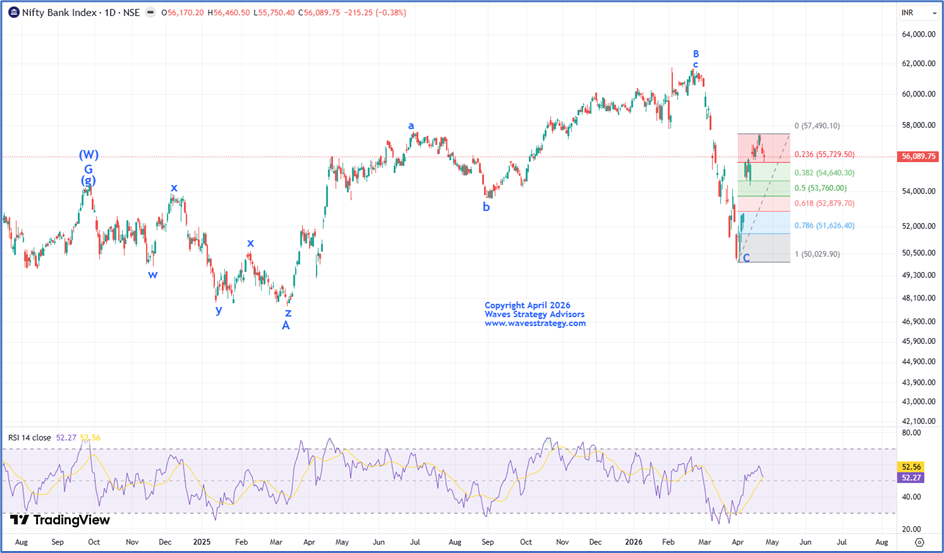
Bank nifty Daily chart as on 24th April 2026
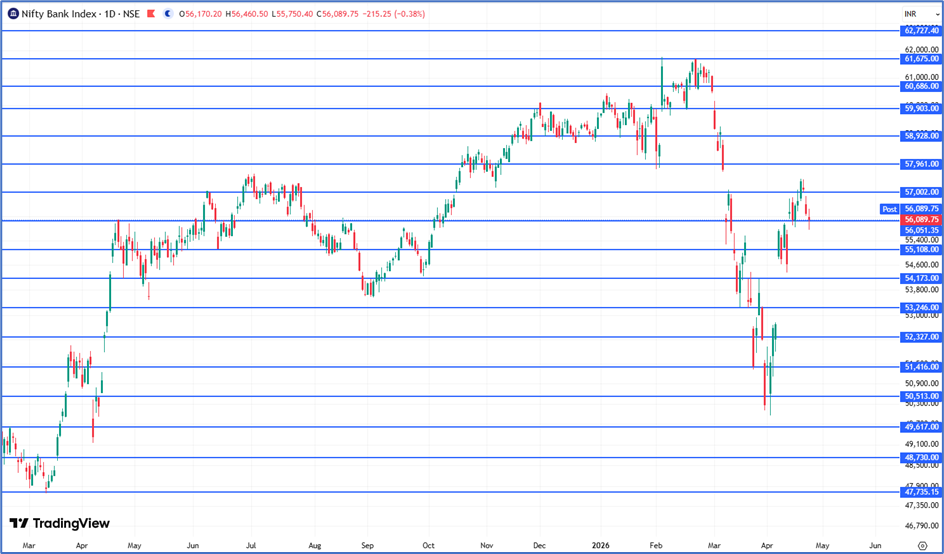
Bank Nifty Daily chart with Gann level
Since the start of April 2026, Indian markets stayed very sensitive to the rising tensions between the United States and Iran. Because of this, Crude oil prices moved higher and investors became cautious. Banking and financial stocks saw strong volatility during this period.
On the daily chart, we can see that index is witnessing some profit booking and prices are back to the Gann level of 56,051. The index has retraced nearly 23.6% of the rally that began in April 2026. Going forward, any decisive breach below the 55,750 level could open the doors for a deeper correction towards the 38.2% retracement level, which is placed around 54,658 levels.
From a structural standpoint, Bank Nifty has recently formed a minor short-term top (approximately three sessions ago) and is currently undergoing a partial retracement of the recent up move. Given the ongoing event-driven environment, the index is also likely to witness gap-based movements, similar to the broader market. On the upside, a decisive breakout above 57,500 would signal a resumption of bullish momentum, potentially driving the index towards the 60,000 mark. On the downside, the immediate support zone is placed in the 53,000–54,000 region, which remains critical to hold in order to maintain the current structure.
In conclusion, Bank Nifty is expected to remain range-bound in the near term, with a defined trading band between 54,000 and 60,000 over the coming weeks. This phase is likely to be characterized by rotational participation within banking segments, along with event-driven volatility, making it conducive for tactical trading opportunities within the range.
Bank nifty Daily Chart Happened as on 18th May 2026
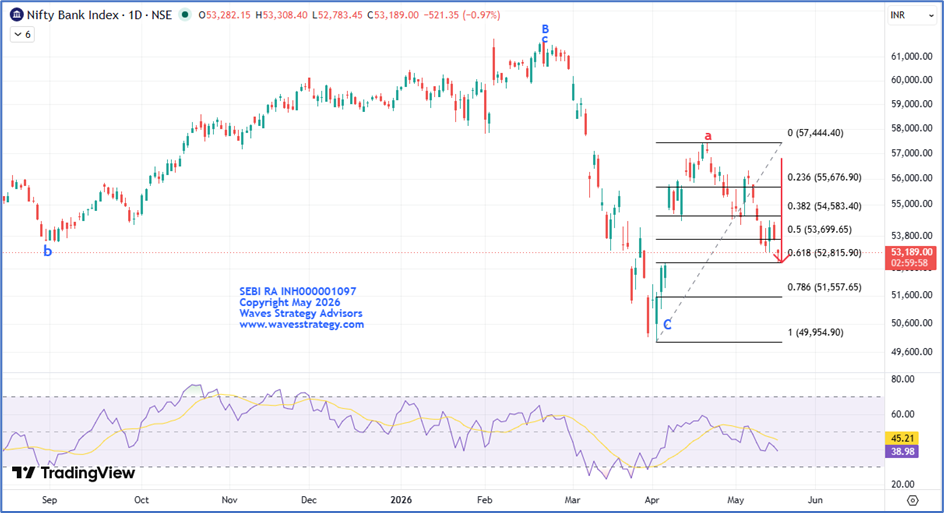
Happened as on 18th May 2026
Bank Nifty moved precisely as anticipated. The index retraced to the 38.2% Fibonacci zone, broke below the crucial 54,000 support area, and continued drifting lower to mark a low of 52,783 in today’s session. This level also coincides with the 61.8% retracement of the prior rally that began in April 2026, making it a critical support zone.
A sustained break below the 61.8% retracement could further intensify selling pressure, dragging prices towards the key Gann level near 52,327 or even lower. On the upside, Bank Nifty needs to reclaim and sustain above 54,400 to signal some stability and ease the current bearish pressure.
Brahmastra (Mentorship on Timing the market)
Learn to time the market and trade with me for the period of 3 Months including Live trading, stock selection, Momentum, and Multibagger stock identification, Timing the entry to the very Day, Hour, and Minute using Time cycles and Elliott Wave analysis. Get access to Kaal Chakra (Master of Cycles) as soon as you register for Mentorship, Fill below form for more details: