
Bank Nifty could Be Preparing for Its Next Explosive Move!
Oct 16, 2026
Neo Wave analysis, when combined with Time Cycle studies, helps create high-probability trade setups with greater accuracy by aligning price structure with timing, allowing traders to identify stronger entries, better risk control and more reliable market reversals.
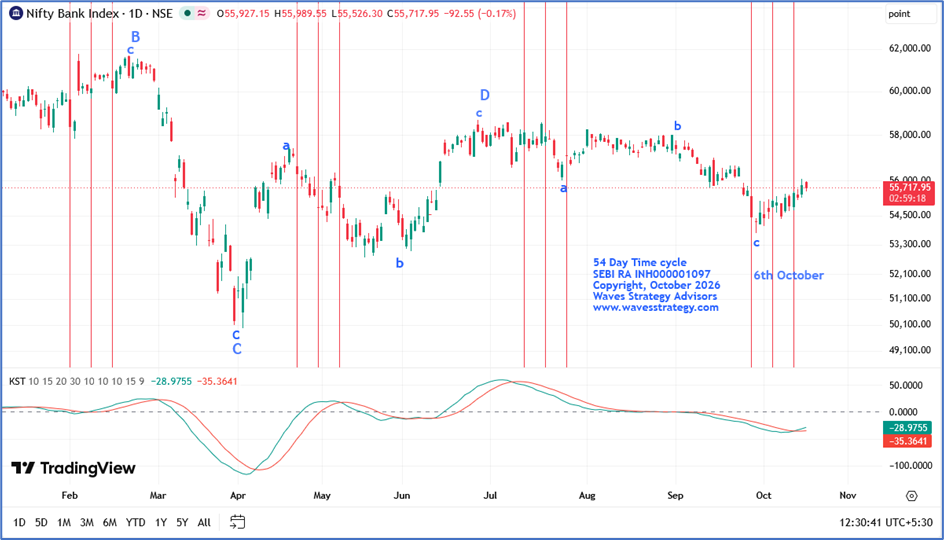
BANKNIFTY Daily chart with Time Cycle and KST Indicator
Analysis
- Bank Nifty has been following the 54 Period Time cycle and as expected prices formed a short term low within the cycle zone (06th October 2026 - 13th October 2026) and is now heading higher since 29th September 2026 in the form of Higher High and Higher Low structure.
- Also, with results season currently ongoing and majority of the banks will be announcing their quarterly results over the weekend such as HDFCBANK, ICICIBANK, AXISBANK, IDBIBANK etc index and stocks can show high volatility.
- This indicates that the market participants are expecting positive results OR this might just be another pullback which will only unfold as the session continues.
Wave Analysis
- The fall since July 2026 till end of September 2026 was in the form of wave c which is expected to get completed.
- A move above 56700 will confirm the completion of wave c on the downside. This move may also indicate the completion of wave c on the downside.
KST Indicator
- The KST (Know Sure Thing) Indicator is a momentum-based indicator. It helps traders assess the overall strength and direction of price movement.
- When the KST line crosses above the Signal line → Early sign of bullish momentum.
- When it moves above the Zero line → Confirms strengthening of bullish momentum.
- It is particularly useful for identifying trend shifts and momentum confirmation.
- On the daily chart, KST line has already crossed above the Signal line and is heading towards the zero line. If KST line crosses above Zero line bullish momentum is expected to pick up due to which further upside move can be seen in upcoming trading sessions.
Conclusion
- Time Cycle, when combined with simple price action and KST, can provide powerful trend signals.
- Entering at the right time of the breakout can help traders capture a trending move efficiently.
- A decisive move above 56051 (Gann square of 9) can extend this rally further to 56500 followed by 57002.
- On the downside, 55100 remains the nearest support level and any break below the same prices can test the cycle low again.
Learn Advanced Technical Analysis with Brahmastra
Brahmastra — Technical Analysis Mentorship
Learn the science of trading with algo creation, stock selection, options trading, Elliott Wave and Neowave.
In the Brahmastra sessions, you will learn how these concepts can be combined to develop a structured approach to market analysis and trading. Fill below form for more details: