
Bank Nifty Below 55000: Is More Downside Ahead as Time Cycle Nears?
Oct 08, 2026
Elliott Wave analysis, when combined with price action and Time-cycle analysis, can provide a structured framework for identifying potential market turning points and high-probability trade setups. This integrated approach helps traders assess market structure, timing, momentum, and possible trend reversals, offering valuable insights for short- to medium-term trading decisions and risk management
Lets understand analyse Banknifty with the help of above advance tools.
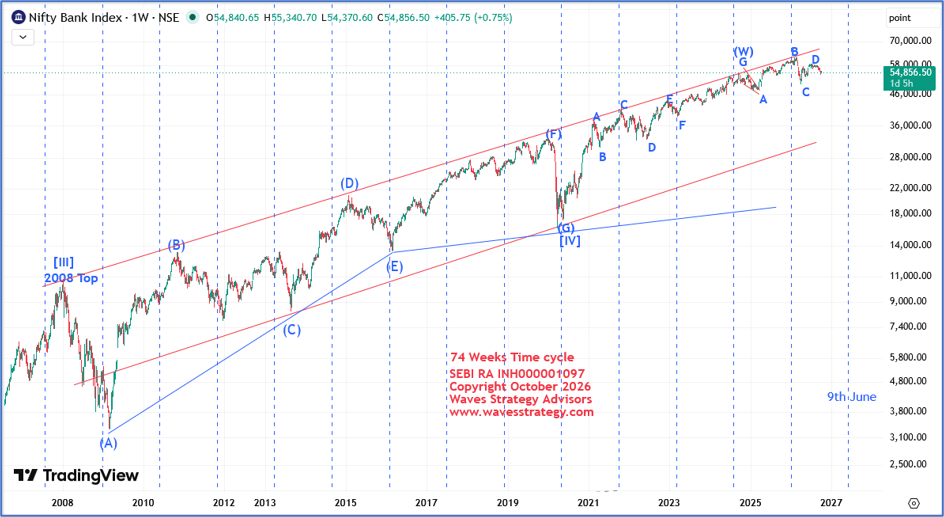
Bank Nifty Weekly chart with Neo wave
Bank Nifty Daily chart
Analysis
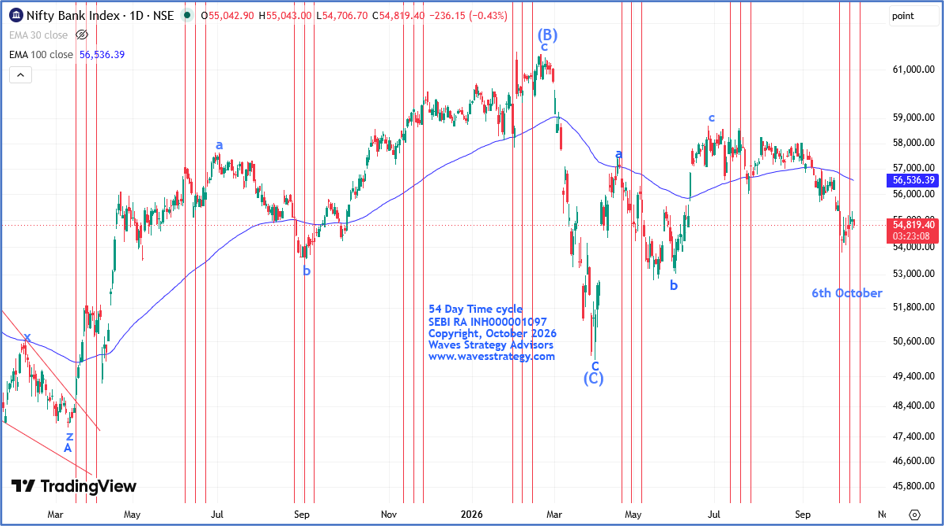
- Bank Nifty was trading between 56000–58700 range for nearly two months, index finally breached the lower boundary at the beginning of September.
- This suggests that the broader short-term trend remains weak.
- The breakdown from the prolonged consolidation has altered the near-term market structure.
- A sustained sequence of lower highs and lower lows confirms index is in downtrend.
- Until a reversal takes shape, pullback moves are likely to attract selling pressure.
Elliott wave Analysis
- From a wave perspective, following the completion of Wave (W) in October 2024, the corrective phase appears to be unfolding as Wave (X).
- Wave (X) is likely developing in the form of a triangle pattern.
- Within this structure, Wave (D) appears to have recently completed near the upper boundary of the triangle.
- The subsequent decline is currently being viewed as Wave (E) of the triangle pattern.
- Wave (E) may continue to develop within the broader corrective structure.
Time Cycle
- Bank Nifty is trading within its 54-period time cycle zone which has already started with last part of zone ending on 13th October 2026.
- During this phase, prices are expected to remain under pressure.
- We will closely monitor the setup for signs of a possible reversal or buying opportunity. Until that happens one should avoid creating longs.
RBI Monetary Policy
- The RBI raised the Repo Rate by 25 bps to 5.50%, indicating a tighter monetary policy stance in its recent MPC held yesterday on 07th October 2026.
- The monetary policy stance shifted from Neutral to Calibrated Tightening, signaling limited scope for near-term rate cuts.
- The FY27 GDP growth forecast was raised by 40 bps to 7.1%, reflecting stronger economic growth expectations.
- The FY27 CPI inflation forecast stands at 5.2%, indicating continued inflationary pressure.
The next RBI Monetary Policy meeting is scheduled for December 2–4, 2026.
Conclusion
- The combination of Elliot Wave structure, price action, Time Cycle suggests the trend is on the side of bears.
- Bank Nifty is likely to remain under pressure, with the 54-day time cycle adding more pressure.
- A sustained move below 54600 can extend the down move towards the key support of 54173 followed by 53800 On the upside, 55400 is the nearest resistance and breach above the same can result into fresh pullbacks.
Learn Advanced Technical Analysis with Brahmastra
Brahmastra — Technical Analysis Mentorship
Learn the science of trading with algo creation, stock selection, options trading, Elliott Wave and Neowave.
In the Brahmastra sessions, you will learn how these concepts can be combined to develop a structured approach to market analysis and trading. Know more
Advanced Technical Analysis Training — Elliott Wave, Neowave & Options
Our 3-month Trishul Advanced Technical Analysis Training focuses on Elliott Wave and Neowave concepts along with powerful options strategies.
Learn the complete science of trading using the principles of Elliott Wave, Neowave and options, including techniques for market forecasting and identifying potential market structures.
The next session is scheduled for 10th and 11th October, Saturday and Sunday.
Limited seats only. Fill the form below for more details.