
Bank Nifty Under Pressure: Is This a Breakdown or a Trap?
Sep 08, 2026
Markets leave footprints before every major move. The key is knowing how to read them while Gann Square of 9 helps identify important price levels, simple price action combined with Volume analysis can provide clear guidance for trading in any instrument over short to medium term.
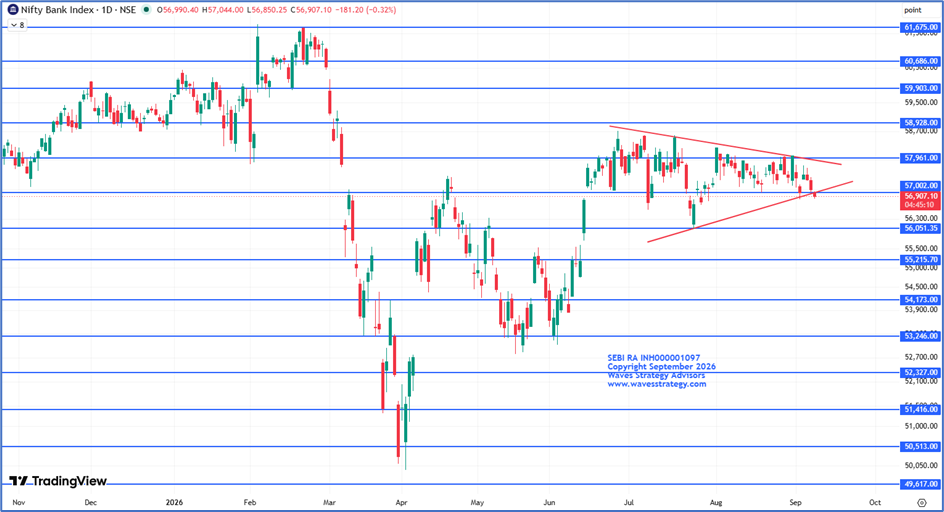
Bank Nifty Daily chart with Gann levels
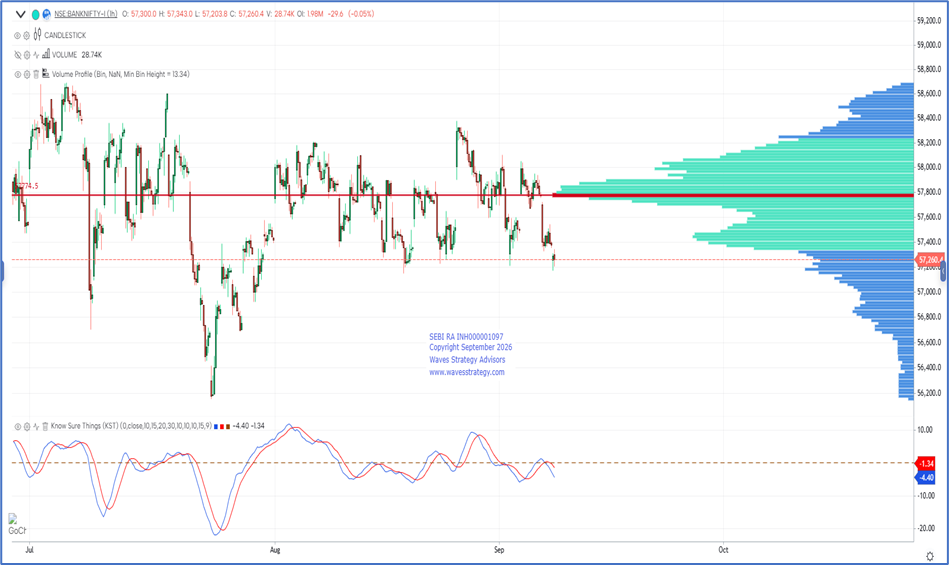
Bank Nifty Hourly chart with Volume Profile and KST Indicator
Price action
- Index was trading within a symmetrical triangle pattern, since end of June 2026 with upper and lower trendlines converging, showing decreasing volatility in the index.
- In today’s session, prices broke below the lower trendline signalling a breakdown of the pattern which is a negative sign.
- However, a daily close below the lower trendline is much needed to confirm the same.
Gann square of 9
- Index has also broken below the 57002 Gann levels and is currently trading below it. For now, any sustained move below the same can drag prices further lower attracting renewed selling interest towards next Gann levels of 56051.
- It is truly remarkable how combining Gann square of 9 with simple price action can consistently help to forecast support and resistance with such high accuracy.
- It also strengthens conviction and improves the probability of capturing meaningful price moves.
Volume Profile
- Volume Profile is an advanced analytical tool that displays the price levels where significant trading activity has occurred.
- It helps traders identify areas of high and low market participation based on trading volume.
- POC represents the price level with the highest traded volume. It acts as a magnet level, where the price tends to revisit frequently.
- It can also help to identify strong support and resistance zones and can improve entry and exit precision.
-
Currently it can be observed that post taking resistance of the POC level near 57775 prices are now heading lower towards the low volume node indicating the significance of it.
KST Indicator
- The KST (Know Sure Thing) Indicator is a momentum-based indicator. It helps traders assess the overall strength and direction of price movement.
- When the KST line crosses above the Signal line → Early sign of bullish momentum.
- When it moves above the Zero line → Confirms strengthening of bullish momentum.
- It is particularly useful for identifying trend shifts and momentum confirmation.
- On the hourly chart, KST line has already crossed below the Signal line and is trading below the zero line. This suggests index is gaining momentum on the downside.
Conclusion
- Bank nifty has broken below the triangle pattern and is now heading lower towards the Gann level of 56051 level.
- The trend for the index looks to be on the downside as per price action, Gann Square of 9, Volume Profile and KST Indicator.
- For now, traders can use sell on rise as an opportunity to ride the trend on the downside towards 56550 – 56390 with the short-term resistance being around the 57420 level.
Brahmastra (Mentorship) on timing the market using Hurst’s Time cycles along with Elliott wave, Neo wave, complete handholding & stock selection algo creation with access to traders community. A mentor can change the learning curve that can take years to a few months. Act now, Know More
If you want to go beyond individual market forecasts and learn a systematic approach to analysing stocks and options, our Trishul Membership combines multiple technical-analysis techniques into one framework.
The program covers:
- Keltner Channel + KST applied directly to options charts
- Neo Wave for understanding market structure and forecasting
- Ichimoku Cloud for trend and momentum analysis
- Practical methods for analysing stocks and options
Trishul Membership — 3 Months
Limited seats are available.
Fill in the form below for more details.