Bank Nifty: Understand the Elliott Wave Structure Behind the Down Move
Jul 14, 2020We have been constantly hinting sign of concern on Bank Nifty and mentioning in our report to be caustious and not getting carried away with the moves. Triangle formation and channel resistance was the key reversal indication for the down move.
There are simple indicators that can help in capturing the short term reversal and if you combine it with Elliott wave short term pattern it can provide a great insight and trade setup.
Look at the below chart of Bank Nifty which was published in daily equity report “The Financial waves short term update” on 03rd July 2020 morning:
Bank Nifty 60 mins chart: Anticipated on 3rd July 2020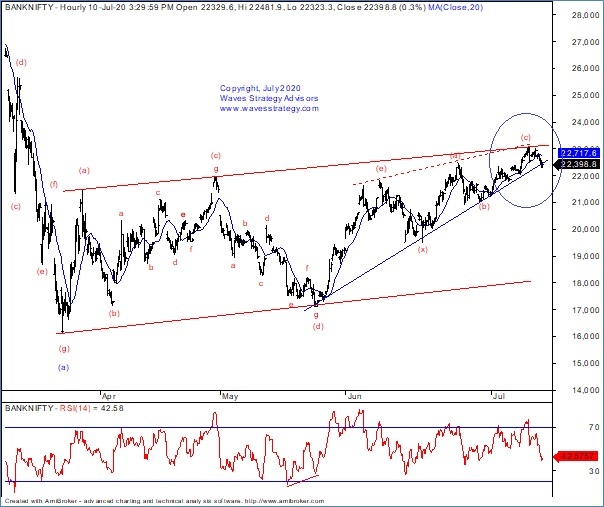
Bank Nifty 60 mins chart: Happened till now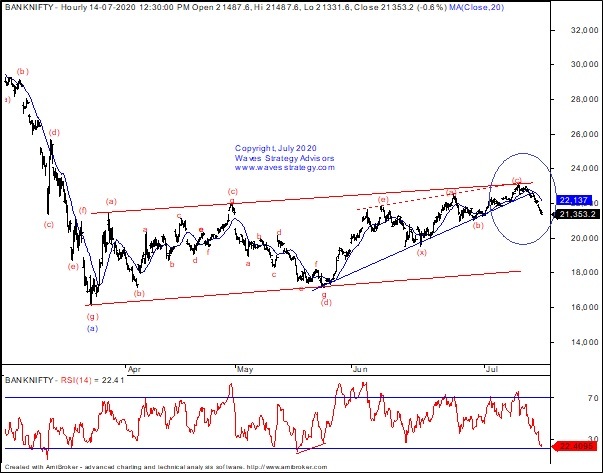
Wave Analysis:
On the weekly chart, Bank Nifty formed a shooting star like candle which is considered a bearish reversal pattern but a weekly close below the low of this candle near 22040 is essential to see any bearish follow through on this time frame……
On the daily chart we can see that Bank Nifty is moving in the form of wave (b) (blue) within wave (G).This wave (b) seems to be unfolding as a complex correction.
On the hourly chart we can see that a triangle formed in the first leg of wave (b) (blue) and it appears that an extracting triangle could be unfolding in the second leg currently. As of now wave (d) seems to be ongoing. We expect price to consolidate between 23100 – 22000 levels over the next session or two. A decisive break below 22000 can drag the index lower towards ….. levels.
In a nutshell, Bank Nifty is at crucial juncture and in a range between 23100-22000. A decisive break of this range is required for a trending move to emerge in the direction of the breakout.
Happened: As mentioned earlier once we see break of important range i.e 23100-22000 a trending move can be seen. It seems that the up move was a trap and currently we are seeing decisive downward movement as per Elliott wave. Also to get the detailed medium term view on Bank Nifty you can get in our recent Monthly Research Report. Get your Monthly Copy here
Get access to “The Financial Waves short term update” and see the application of Elliott and its pattern formation and implication. See yourself here
Subscribe to Intraday / Positional advisory on stocks where there is intraday trading opportunity across the Index and stocks. Register here
Get clear Trade Setups in the upcoming ONLINE training scheduled on 25th &26th July 2020 in Master of Technical analysis (MOTA). Also learn about Neo wave, Elliott wave, Time cycles scheduled on 22nd- 23rd August 2020 Master of Wave (MOW). You do not necessarily require prior knowledge of technical analysis and we will ensure you get it right from the very basic to most advanced level. Hurry up few seats left. Know more here