Bank Nifty Using Bollinger Bands, Elliott Wave Pattern
May 12, 2022
Like this Article? Share it with your friends!
Bank Nifty has been moving lower in a corrective pattern. Check out this example of how we used Bollinger bands with price movement to identify the wave counts and predict the price movement.
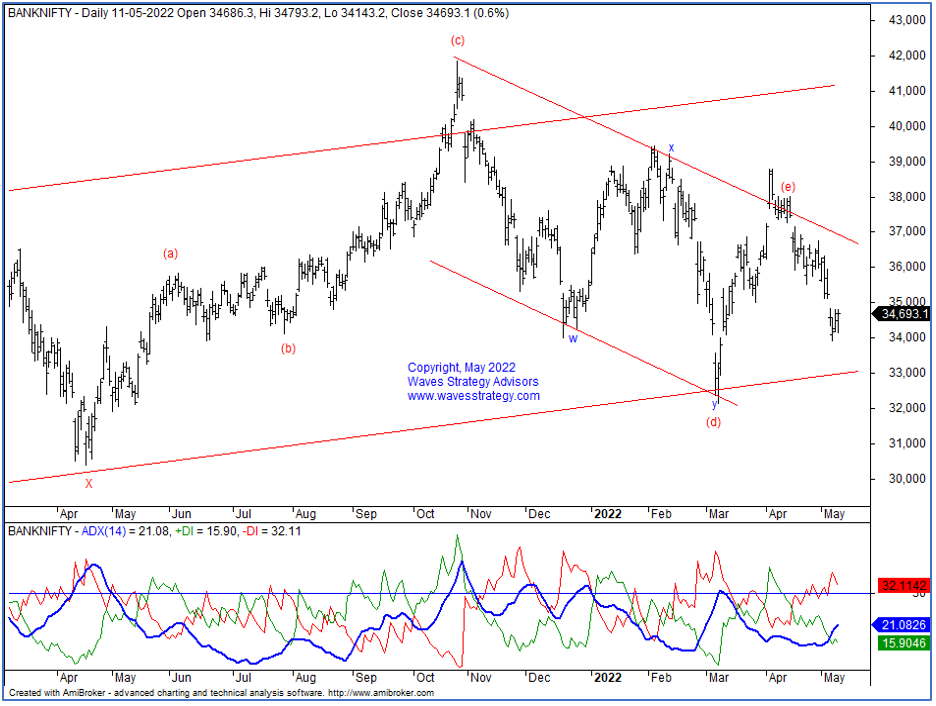
Bank Nifty Daily Chart as on 12th May 2022
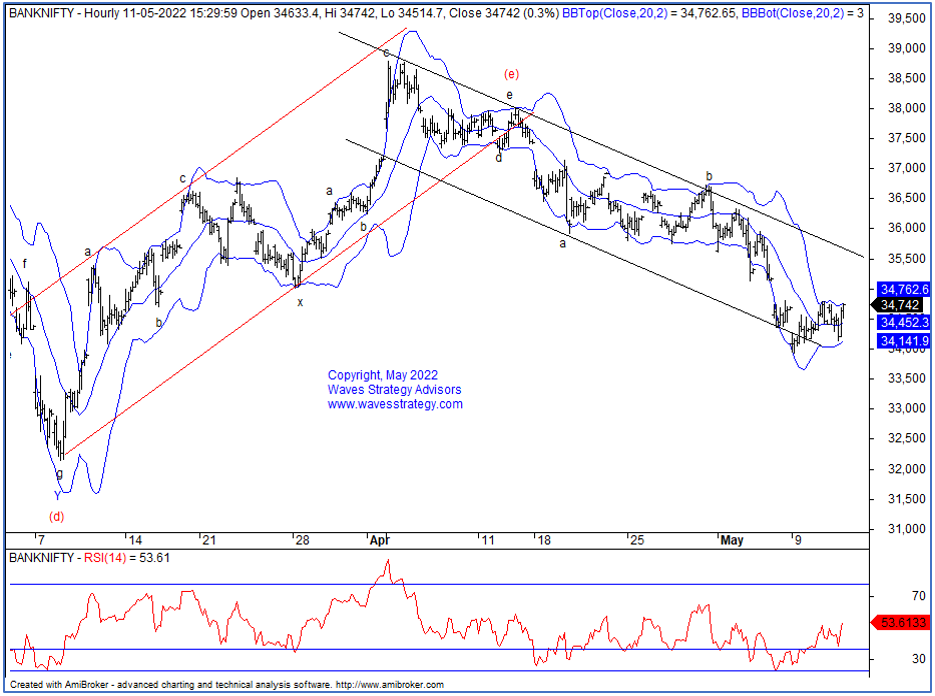
Bank Nifty 60 mins chart:
Waves analysis as we published on 12th may 2022

In the previous session Bank Nifty formed a Doji candle which indicates indecision and closed with a gain of 0.61%. On the daily chart we have applied ADX which is currently trading at 21.49 which indicates a sideways move. If it crosses 25 then that will be considered as a trending move. However, from preceding 4 trading sessions BANKNIFTY is moving in a same range that is in between 34200-34800 levels. Any breakout of the above-mentioned range will help to understand a bigger trend.
On the hourly chart, prices are moving well within the downward sloping channel. We have applied Bollinger Bands. As we can see in the chart that Bollinger Bands are looking flat which suggest consolidation or sideways move. However, any move above 34850 will suggest that wave c has completed its course and another leg has started on the upside in form of wave d.
In short, BANKNIFTY is at a crucial junction. Index is trading in a range between 34200-34800 levels. A break of above range can result into a trending move.
Bank Nifty as on 12th May 2022
In today’s morning report, we have mentioned that the range breakout is necessary to understand the bigger picture. We can see that; Bank Nifty had a gap down opening and given break on the downside after consolidating for almost 4 trading sessions.
However, if Bank Nifty gives a daily close below the rectangular range it can drift towards 33300 levels followed by 32300 levels. The overall trend is still in bearish. The prices are still moving in form of wave c on the downside. So, sell on rise is the best strategy to use in this market. Elliott wave along with indicator, we can easily identify the trend
We have been generating advisory calls on Nifty, Bank Nifty, Stocks, Commodity and Currency using such advanced technical analysis methods and it has worked out extremely well. You can avail combo research at never before pricing under the Summer Offer 2021. Check here
Master of Waves Season 3 - Learn Trade setups for Intraday to Positional on Stocks, Commodity, Options using Neo wave and Time cycles. This is simple method provided you understand it from someone who has been practicing it for years. Be a part of the Elite Traders community #TimeTraders and time the market like a pro. 2 days of Live event on 28th – 29th May 2022, Limited seats only, register now over here